

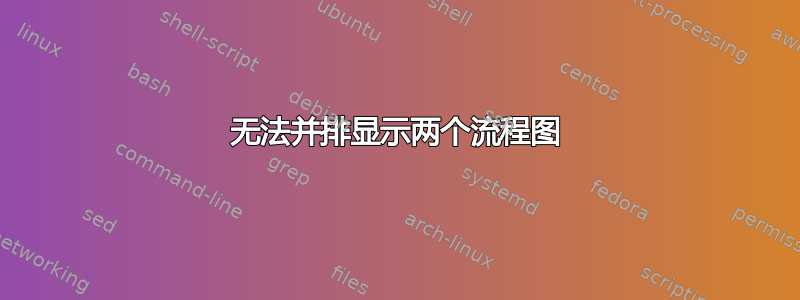
大家好,有谁能帮我一下吗?这是我第一次使用 Latex。我必须并排添加 2 个流程图。但我编写的代码会并排打印图表,但两个图表的第二个表格是相连的,而且它们并不是完全分开的。有谁能帮我一下,如何才能有完全分开的并排表格?我还添加了代码,我用它来编译图片中的这个 pdf。

 \documentclass[a4paper,10pt]{article}
\usepackage[utf8]{inputenc}
\usepackage{tikz}
\usetikzlibrary{matrix,shapes,arrows,positioning,chains}
\usetikzlibrary{shapes.geometric, arrows}


\usetikzlibrary{shapes.geometric, arrows, shadows}
\begin{document}
\begin{figure}
\centering
\tikzstyle{startstop} = [trapezium, rounded corners, minimum width=3cm, minimum height=1cm,text centered, draw=black, fill=red!30, drop shadow]
\tikzstyle{startstop} = [trapezium, rounded corners, minimum width=3cm, minimum height=1cm,text centered, draw=black, fill=red!30, drop shadow]

\tikzstyle{io} = [trapezium, trapezium left angle=70, trapezium right angle=110, minimum width=2cm, minimum height=1cm, text centered, draw=black, fill=blue!30]
\tikzstyle{process} = [rectangle, minimum width=3cm, minimum height=1cm, text centered, text width=3cm, draw=black, fill=orange!30]
\tikzstyle{decision} = [diamond, minimum width=3cm, minimum height=1cm, text centered, draw=black, fill=green!30]
\tikzstyle{arrow} = [thick,->,>=stealth]
\tikzstyle{line} = [draw, -latex']


\begin{tikzpicture}[node distance=2cm, auto]
\begin{scope}[local bounding box=left]

\node (start) [startstop] {Start};
\node (in1) [io, below of=start] {Covid\Non-Covid data};
\node (pro1) [process, below of=in1] {Feature extraction};
\node (in3) [process, below of=pro1] {Feature selection};

%\node (pro2b) [process, right of=dec1, xshift=2cm] {};
\node (out1) [io, below of=in3] {classifier};
\node (stop) [startstop, below of=out1] {Results};

\draw [arrow] (start) -- (in1);
\draw [arrow] (in1) -- (pro1);
\draw [arrow] (pro1) -- (in3);

\draw [arrow] (in3) -- (out1);
\draw [arrow] (out1) -- (stop);

\end{scope}
\draw[color=gray,thick](left.south west) rectangle (left.north east);
\node[anchor=north,font=\bfseries] at ([yshift=-2em]left.south) {flow 1 label};
\begin{scope}[local bounding box=right,xshift=6cm]


\node (start) [startstop] {Start};
\node (in1) [io, below of=start] {Covid/Non-Covid data};
\node (pro1) [process, below of=in1] {Feature extraction};
\node (in3) [process, below of=pro1] {Feature selection};

%\node (pro2b) [process, right of=dec1, xshift=2cm] {};
\node (out1) [io, below of=in3] {classifier};
\node (stop) [startstop, below of=out1] {Results};

\draw [arrow] (start) -- (in1);
\draw [arrow] (in1) -- (pro1);
\draw [arrow] (pro1) -- (in3);

\draw [arrow] (in3) -- (out1);
\draw [arrow] (out1) -- (stop);
 % % % % % % % % % % % % % % % %
\end{scope}
\draw[color=gray,thick](right.south west) rectangle (right.north east);
\node[anchor=north,font=\bfseries] at ([yshift=-2em]right.south) {flow 2 label};

\end{tikzpicture}


\end{figure}


\end{document}
答案1
您可以使用该
trapezium stretches=true选项来节省一些空间,然后两个图表将并排显示\是 latex 中表示宏名称开头的特殊字符。您不能在文本中使用它。要打印 \,请使用\textbackslash。
\documentclass[a4paper,10pt]{article}
\usepackage[utf8]{inputenc}
\usepackage{tikz}
\usetikzlibrary{matrix,shapes,arrows,positioning,chains}
\usetikzlibrary{shapes.geometric, arrows}


\usetikzlibrary{shapes.geometric, arrows, shadows}
\begin{document}
\begin{figure}
\centering
\tikzset{startstop/.style={trapezium, rounded corners, minimum width=3cm, minimum height=1cm,text centered, draw=black, fill=red!30, drop shadow}}
\tikzset{startstop/.style={trapezium, rounded corners, minimum width=3cm, minimum height=1cm,text centered, draw=black, fill=red!30, drop shadow}}

\tikzset{io/.style={trapezium, trapezium left angle=70, trapezium right angle=110, minimum width=2cm, minimum height=1cm, text centered, draw=black, fill=blue!30,trapezium stretches=true}}
\tikzset{process/.style={rectangle, minimum width=3cm, minimum height=1cm, text centered, text width=3cm, draw=black, fill=orange!30}}
\tikzset{decision/.style={diamond, minimum width=3cm, minimum height=1cm, text centered, draw=black, fill=green!30}}
\tikzset{arrow/.style={thick,->,>=stealth}}
\tikzset{line/.style={draw, -latex'}}


\begin{tikzpicture}[node distance=2cm, auto]
\begin{scope}[local bounding box=left]

\node (start) [startstop] {Start};
\node (in1) [io, below of=start] {Covid\textbackslash Non-Covid data};
\node (pro1) [process, below of=in1] {Feature extraction};
\node (in3) [process, below of=pro1] {Feature selection};

%\node (pro2b) [process, right of=dec1, xshift=2cm] {};
\node (out1) [io, below of=in3] {classifier};
\node (stop) [startstop, below of=out1] {Results};

\draw [arrow] (start) -- (in1);
\draw [arrow] (in1) -- (pro1);
\draw [arrow] (pro1) -- (in3);

\draw [arrow] (in3) -- (out1);
\draw [arrow] (out1) -- (stop);

\end{scope}
\draw[color=gray,thick](left.south west) rectangle (left.north east);
\node[anchor=north,font=\bfseries] at ([yshift=-2em]left.south) {flow 1 label};
\begin{scope}[local bounding box=right,xshift=6cm]


\node (start) [startstop] {Start};
\node (in1) [io, below of=start] {Covid/Non-Covid data};
\node (pro1) [process, below of=in1] {Feature extraction};
\node (in3) [process, below of=pro1] {Feature selection};

%\node (pro2b) [process, right of=dec1, xshift=2cm] {};
\node (out1) [io, below of=in3] {classifier};
\node (stop) [startstop, below of=out1] {Results};

\draw [arrow] (start) -- (in1);
\draw [arrow] (in1) -- (pro1);
\draw [arrow] (pro1) -- (in3);

\draw [arrow] (in3) -- (out1);
\draw [arrow] (out1) -- (stop);
 % % % % % % % % % % % % % % % %
\end{scope}
\draw[color=gray,thick](right.south west) rectangle (right.north east);
\node[anchor=north,font=\bfseries] at ([yshift=-2em]right.south) {flow 2 label};

\end{tikzpicture}


\end{figure}


\end{document}

这是两个真正使用positioning和/或的细微修改chains。
\documentclass[a4paper,10pt]{article}
\usepackage[utf8]{inputenc}
\usepackage{tikz}
\usetikzlibrary{arrows,chains,positioning,shadows,shapes.geometric}
\begin{document}
\begin{figure}
\centering
\tikzset{startstop/.style={trapezium, rounded corners, minimum width=3cm, minimum height=1cm,text centered, draw=black, fill=red!30, drop shadow},
startstop/.style={trapezium, rounded corners, minimum width=3cm, minimum height=1cm,text centered, draw=black, fill=red!30, drop shadow},
io/.style={trapezium, trapezium left angle=70, trapezium right angle=110, minimum width=2cm, minimum height=1cm, text centered, draw=black, fill=blue!30,trapezium stretches=true},
process/.style={rectangle, minimum width=3cm, minimum height=1cm, text centered, text width=3cm, draw=black, fill=orange!30},
decision/.style={diamond, minimum width=3cm, minimum height=1cm, text centered, draw=black, fill=green!30},
arrow/.style={thick,->,>=stealth},
line/.style={draw, -latex'}}
%
\begin{tikzpicture}[node distance=1cm, auto]
\begin{scope}[local bounding box=left]
\node (start) [startstop] {Start};
\node (in1) [io, below=of start] {Covid\textbackslash Non-Covid data};
\node (pro1) [process, below=of in1] {Feature extraction};
\node (in3) [process, below=of pro1] {Feature selection};
\node (out1) [io, below=of in3] {classifier};
\node (stop) [startstop, below=of out1] {Results};
\draw [arrow] (start) -- (in1);
\draw [arrow] (in1) -- (pro1);
\draw [arrow] (pro1) -- (in3);
\draw [arrow] (in3) -- (out1);
\draw [arrow] (out1) -- (stop);
\end{scope}
\draw[color=gray,thick]([xshift=-1ex,yshift=-1ex]left.south west)
    rectangle ([xshift=1ex,yshift=1ex]left.north east);
\node[anchor=north,font=\bfseries] at ([yshift=-2em]left.south) {flow 1 label};
%
\begin{scope}[local bounding box=right,xshift=6cm]
\node (start) [startstop] {Start};
\node (in1) [io, below=of start] {Covid/Non-Covid data};
\node (pro1) [process, below=of in1] {Feature extraction};
\node (in3) [process, below=of pro1] {Feature selection};
\node (out1) [io, below=of in3] {classifier};
\node (stop) [startstop, below=of out1] {Results};
\draw [arrow] (start) -- (in1);
\draw [arrow] (in1) -- (pro1);
\draw [arrow] (pro1) -- (in3);
\draw [arrow] (in3) -- (out1);
\draw [arrow] (out1) -- (stop);
 % % % % % % % % % % % % % % % %
\end{scope}
\draw[color=gray,thick]([xshift=-1ex,yshift=-1ex]right.south west)
    rectangle ([xshift=1ex,yshift=1ex]right.north east);
\node[anchor=north,font=\bfseries] at ([yshift=-2em]right.south) {flow 2 label};
\end{tikzpicture}
\end{figure}


\begin{figure}
\centering
\tikzset{startstop/.style={trapezium, rounded corners, minimum width=3cm, minimum height=1cm,text centered, draw=black, fill=red!30, drop shadow},
startstop/.style={trapezium, rounded corners, minimum width=3cm, minimum height=1cm,text centered, draw=black, fill=red!30, drop shadow},
io/.style={trapezium, trapezium left angle=70, trapezium right angle=110, minimum width=2cm, minimum height=1cm, text centered, draw=black, fill=blue!30,trapezium stretches=true},
process/.style={rectangle, minimum width=3cm, minimum height=1cm, text centered, text width=3cm, draw=black, fill=orange!30},
decision/.style={diamond, minimum width=3cm, minimum height=1cm, text centered, draw=black, fill=green!30},
arrow/.style={thick,->,>=stealth},
line/.style={draw, -latex'}}
%
\begin{tikzpicture}[node distance=1cm, auto]
\begin{scope}[local bounding box=left]
 \path[start chain=going below,join=by arrow, nodes={on chain,join}]
   node (start) [startstop] {Start}
   node (in1) [io] {Covid\textbackslash Non-Covid data}
   node (pro1) [process] {Feature extraction}
   node (in3) [process] {Feature selection}
   node (out1) [io] {classifier}
   node (stop) [startstop] {Results};
\end{scope}
\draw[color=gray,thick]([xshift=-1ex,yshift=-1ex]left.south west)
    rectangle ([xshift=1ex,yshift=1ex]left.north east);
\node[anchor=north,font=\bfseries] at ([yshift=-2em]left.south) {flow 1 label};
\begin{scope}[local bounding box=right,xshift=6cm]
 \path[start chain=going below,join=by arrow, nodes={on chain,join}]
  node (start) [startstop] {Start}
  node (in1) [io] {Covid/Non-Covid data}
  node (pro1) [process] {Feature extraction}
  node (in3) [process] {Feature selection}
  node (out1) [io] {classifier}
  node (stop) [startstop] {Results};
 % % % % % % % % % % % % % % % %
\end{scope}
\draw[color=gray,thick]([xshift=-1ex,yshift=-1ex]right.south west)
    rectangle ([xshift=1ex,yshift=1ex]right.north east);
\node[anchor=north,font=\bfseries] at ([yshift=-2em]right.south) {flow 2 label};
\end{tikzpicture}
\end{figure}
\end{document}
