

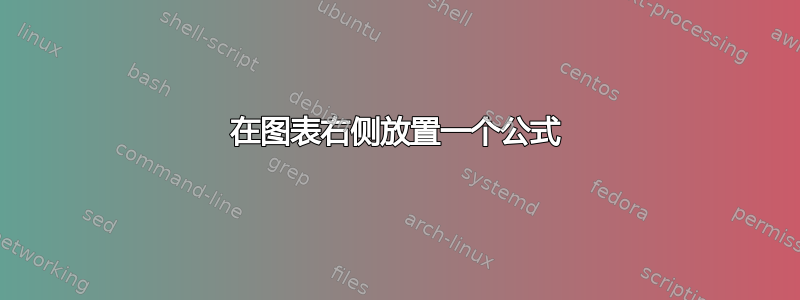
我在将函数 f 的公式置于下图的中心时遇到了麻烦:
$$
\begin{array}{ccc}
\begin{tikzpicture}[scale=0.6]
\draw[line width=0.8pt][->] (-3.5,0)--(3.5,0);
\draw[line width=0.8pt][->] (0,-3)--(0,3);
\draw[line width=0.7pt][color=red] (-3,-1)--(0,-1);
\draw[line width=0.7pt][color=red] (0,1)--(3,1);
\draw[red] (0,1) circle(3pt);
\draw[red] (0,-1) circle(3pt);
\end{tikzpicture}
&{\hspace{1cm}}&
f(x)
\ =\
\left\{
\begin{array}{cl}
-1 & \text{for }x<0
\\[0.5ex]
1 & \text{for }x>0
\end{array}
\right.
\end{array}
$$
结果如下:

我希望将公式放在中间,即放在图表的横轴上,而不是放在底部。
答案1

\documentclass[10pt,a4paper]{article}
\usepackage[utf8]{inputenc}
\usepackage[T1]{fontenc}
\usepackage{amsmath}
\usepackage{amsfonts}
\usepackage{amssymb}
\usepackage{graphicx, tikz, array}
\usetikzlibrary{positioning}
\begin{document}

        \begin{tikzpicture}[scale=0.6]
            \draw[line width=0.8pt][->] (-3.5,0)--(3.5,0)coordinate(aux);
            \draw[line width=0.8pt][->] (0,-3)--(0,3);
            \draw[line width=0.7pt][color=red] (-3,-1)--(0,-1);
            \draw[line width=0.7pt][color=red] (0,1)--(3,1);
            \draw[red] (0,1) circle(3pt);
            \draw[red] (0,-1) circle(3pt);
            \node[right=1cm of aux]{
            f(x)
            \ =\
                    \left\{
                    \begin{array}{cl}
                        -1 & \text{for }x<0
                        \\[0.5ex]
                        1 & \text{for }x>0
                    \end{array}
                    \right.
                \end{array}
            };
        \end{tikzpicture}

\end{document}
答案2
二三种可能性(感谢@BlackMild 提出另一种选择):
使用
baseline选项tikzpicture并将公式添加到外面。基线将决定tikzpicture相对于同一行上的其他 TeX 框(如公式的组成部分)的垂直位置。将图形放入 a 中
local bounding box,并将公式作为单独的节点放置在此框旁边。这两个节点的放置由 TikZ 控制。将公式作为单独的 TikZ 节点放置在适当的坐标处,使其成为图形的一部分。
从视觉上看,这个例子没有太大的区别,因为图片和公式都是垂直对称的。
TikZ 选项baseline
请注意,的基线f(x)与水平轴对齐,因为我们已经将原点声明为图形的基线。

\documentclass{article}
\usepackage{tikz,amsmath}
\begin{document}
\begin{tikzpicture}[scale=0.6,baseline={(0,0)}]
\draw[line width=0.8pt][->] (-3.5,0)--(3.5,0);
\draw[line width=0.8pt][->] (0,-3)--(0,3);
\draw[line width=0.7pt][red] (-3,-1)--(0,-1);
\draw[line width=0.7pt][red,fill=white] (0,1)--(3,1);
\draw[red,fill=white] (0,1) circle(3pt);
\draw[red,fill=white] (0,-1) circle(3pt);
\end{tikzpicture}
\qquad
\(f(x) = \begin{cases}
         -1 & \text{for $x<0$}\\[0.5ex]
          1 & \text{for $x>0$}
       \end{cases}
\)
\end{document}
TikZ 选项local bounding box

\documentclass{article}
\usepackage{tikz,amsmath}
\usetikzlibrary{positioning}
\begin{document}
\begin{tikzpicture}
  \begin{scope}[scale=0.6,local bounding box=L]
    \draw[line width=0.8pt][->] (-3.5,0)--(3.5,0);
    \draw[line width=0.8pt][->] (0,-3)--(0,3);
    \draw[line width=0.7pt][red] (-3,-1)--(0,-1);
    \draw[line width=0.7pt][red] (0,1)--(3,1);
    \draw[red,fill=white] (0,1) circle(3pt);
    \draw[red,fill=white] (0,-1) circle(3pt);
  \end{scope}
  \node[right=2em of L]
    {\(f(x) = \begin{cases}
         -1 & \text{for $x<0$}\\[0.5ex]
          1 & \text{for $x>0$}
       \end{cases}
    \)};
\end{tikzpicture}
\end{document}
公式位于图形内部

\documentclass{article}
\usepackage{tikz,amsmath}
\begin{document}
\begin{tikzpicture}[scale=0.6]
  \draw[line width=0.8pt][->] (-3.5,0)--(3.5,0) node[right=2em]
    {\(f(x) = \begin{cases}
         -1 & \text{for $x<0$}\\[0.5ex]
          1 & \text{for $x>0$}
       \end{cases}
    \)};
  \draw[line width=0.8pt][->] (0,-3)--(0,3);
  \draw[line width=0.7pt][red] (-3,-1)--(0,-1);
  \draw[line width=0.7pt][red] (0,1)--(3,1);
  \draw[red,fill=white] (0,1) circle(3pt);
  \draw[red,fill=white] (0,-1) circle(3pt);
\end{tikzpicture}
\end{document}