

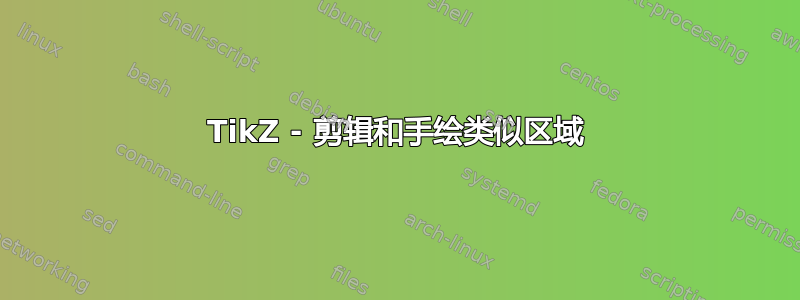
我想画一些这样的东西。

我的问题只是知道如何定义不同的区域而不是进行装饰。
答案1
如果您只需要椭圆的部分填充,可以尝试我的方法。
\documentclass[border=5pt]{standalone}

\usepackage{pgfplots}
\pgfplotsset{compat=newest}
\usepgfplotslibrary{fillbetween}

\begin{document}
    \begin{tikzpicture}
        \begin{scope}
            \clip (0,0) ellipse [x radius=2, y radius=1];
            \path[name path=a] (0,0) ellipse [x radius=2, y radius=1];
            \path[name path=b] (0,-1) to[out=135, in=315] (0,1);

            \draw [fill=cyan!50!white] (0,0) ellipse [x radius=2, y radius=1];

            \draw [fill=green!50!black,
            intersection segments={
                    of=a and b,
                    sequence={L2--R2}
                }
            ];

            \begin{scope}
                \clip (0,-1) circle[radius=1];
                \draw (0,-1) circle[radius=1];
            \end{scope}

        \end{scope}

    \end{tikzpicture}
\end{document}

对于模式,你可以使用patterns或做一些循环,foreach例如
\foreach\i in {-10,-9.75,...,10}{%
    \draw[orange] (\i,0) --++ (45:4);
}
在clip和scope环境中
编辑
我尝试了一下之前的例子,现在它应该可以满足您的需求。
\documentclass[border=5pt]{standalone}

\usepackage{pgfplots}
\pgfplotsset{compat=newest}
\usepgfplotslibrary{fillbetween}

\definecolor{mygreen}{RGB}{19,75,46}
\definecolor{myblue}{RGB}{0,103,125}
\definecolor{mypink}{RGB}{135,34,68}
\definecolor{myorange}{RGB}{172,54,18}

\begin{document}
    \begin{tikzpicture}[scale=2]
        \begin{scope}
            \clip (0,0) ellipse [x radius=2, y radius=1];
            \draw [name path=a, fill=cyan!25!white] (0,0) ellipse [x radius=2, y radius=1];
            \draw[name path=b] (0,-1) to[out=135, in=315] (0,1);

            \draw [fill=green!75!black,
            intersection segments={
                of=a and b,
                sequence={L2--R2}
                }
            ];

            \foreach\i in {-10,-9.75,...,10}{%
                \draw[pink] (\i,-1) --++ (45:4);
            }

            \begin{scope}
                \clip (0,-1) circle[radius=1];
                \draw[name path=c, fill=cyan!25!white] (0,-1) circle[radius=1];
                \draw[name path=b] (0,-1) to[out=135, in=315] (0,1);

                \draw [draw=black,fill=green!75!black,
                intersection segments={
                    of=a and b,
                    sequence={L2--R2}
                    }
                ];

                \foreach\i in {-10,-9.75,...,10}{%
                    \draw[orange] (\i,-2) --++ (135:4);
                }
            \end{scope}
        \end{scope}
    \node[fill=white, inner sep=1pt, font=\footnotesize] at (-0.5,0.5) {$\mathrm{\frac{1}{3}h}$};
    \node[fill=white, inner sep=1pt, font=\footnotesize] at (0.5,0.5) {$\mathrm{\frac{2}{3}h}$};
    \draw (-0.5,0.875) to [out=90, in=90, edge node={node [sloped, above, font=\footnotesize] {$\mathrm{\bar{F}}$}}] (0.5,0.875);
    \fill (-0.5,0.875) circle[radius=0.5pt];
    \fill (0.5,0.875) circle[radius=0.5pt];
    \node[fill=white, inner sep=1pt, font=\footnotesize] at (-0.5,-0.5) {$\mathrm{\frac{1}{4}f}$};
    \node[fill=white, inner sep=1pt, font=\footnotesize] at (0.5,-0.5) {$\mathrm{\frac{3}{4}f}$};
    \draw (-0.5,-0.875) to [out=180, in=90] (-0.875,-1.125) node[below, font=\footnotesize] {{$\mathrm{T}$}};
    \fill (-0.5,-0.875) circle[radius=0.5pt];
    \draw (0.5,-0.875) to [out=0, in=90] (0.875,-1.125) node[below, font=\footnotesize] {{$\mathrm{\bar{T}}$}};
    \fill (0.5,-0.875) circle[radius=0.5pt];

    \path [name path=a] (0,0) ellipse [x radius=2, y radius=1];
    \path[name path=d] (-2,0.5) -- (2,0.5);
    \path[name intersections={of=d and a},];
    \coordinate (P1)  at (intersection-1);
    \draw (P1) --++ (0.125,0.125) node[right, font=\footnotesize] {{$\mathrm{\Omega}$}};
    \fill (P1) circle[radius=0.5pt];
    \end{tikzpicture}
\end{document}
