


\documentclass{article}
\usepackage[utf8]{inputenc}
\usepackage[margin=2cm, top=2cm, includefoot]{geometry}
\usepackage{amsmath, amssymb, amsfonts, latexsym, cancel}
\usepackage{graphicx}
\usepackage{tikz}
\usepackage[most]{tcolorbox}
\usepackage{fancyhdr}
\usepackage[hidelinks]{hyperref}
\usepackage{import}
\usepackage{pgfplots}
\usetikzlibrary{calc}
\usetikzlibrary{patterns}
\pgfplotsset{compat=1.16}

%DEFINIR COLORES------------------------------------------------------------


\definecolor{verdePortada}{HTML}{25662E}


%DEFINIR ALGUNAS VARIABLES--------------------------------------------------------


\renewcommand{\contentsname}{Indice}
\renewcommand{\figurename}{Figura}
\setlength{\headheight}{1.5cm}
\pagestyle{fancy}
\fancyhf{}
\lhead{\includegraphics[width=1.5cm\linewidth]{descarga3.jpg}}
\renewcommand{\headrulewidth}{0.1128cm}
\renewcommand{\headrule}{\hbox to \headwidth{ \color{verdePortada}\leaders\hrule height \headrulewidth\hfill}}
\providecommand{\abs}[2]{\lvert #1\rvert}
\providecommand{\norm}[2]{\lVert #1\rVert}
\begin{document}
Y finalmente, como el seno para ángulos $<$10º se puede sustituir por el ángulo:
\begin{equation}
  \frac{d^2\theta}{dt^2}+\frac{g}{L}\cdot \theta=0
\end{equation}
\begin{figure}[h]
    \centering
\begin{tikzpicture}[thick,>=latex,->]
\begin{scope}

  \draw[->] (0,0) -- (0,-0.4);

\end{scope}
\end{tikzpicture}
\end{figure}
\begin{equation}
 \theta=\theta_{max}\cdot sen(\omega \cdot t+\varphi)
\end{equation}
\begin{figure}[h]
    \centering
\begin{tikzpicture}[thick,>=latex,->]
\begin{scope}

  \draw[->] (0,0) -- (0,-0.4);

\end{scope}
\end{tikzpicture}
\end{figure}
\begin{equation}
 \omega=\sqrt{\frac{g}{L}}
\end{equation}
\begin{figure}[h]
    \centering
\begin{tikzpicture}[thick,>=latex,->]
\begin{scope}

  \draw[->] (0,0) -- (0,-0.4);

\end{scope}
\end{tikzpicture}
\end{figure}
\begin{equation}
 T=\frac{2\cdot \pi}{\omega}
\end{equation}
\begin{figure}[h]
    \centering
\begin{tikzpicture}[thick,>=latex,->]
\begin{scope}

  \draw[->] (0,0) -- (0,-0.4);

\end{scope}
\end{tikzpicture}
\end{figure}
\begin{equation}
 T=2\cdot \pi \cdot\sqrt{\frac{L}{g}}
\end{equation}
\end{document}
答案1
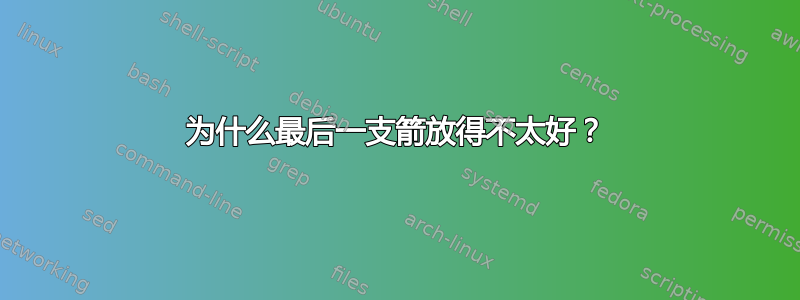
您误用了figure环境,请将其替换figure为center。环境的全部意义figure在于它可以移动以确保更好的分页符,即避免页面末尾出现大量空白。在这种情况下,您不希望内容浮动,并且您无意添加标题,因此figure使用的环境是错误的。
但是,我可能会使用单个gather环境(来自amsmath包),并在单独的行上添加箭头\nonumber。下面的代码演示了这两种方法。
\documentclass{article}
\usepackage{tikz}
\usepackage{amsmath}

% create a custom command for the arrow, so you don't have to repeat
% everything every time
% \tikz is a shortform for \begin{tikzpicture} .. \end{tikzpicture}
\newcommand\MyDownarrow{\tikz\draw[-latex, thick] (0,0) -- (0,-0.4);}

\begin{document}

\section{I'd do this instead}
Y finalmente, como el seno para ángulos $<$10º se puede sustituir por el ángulo:
\begin{gather}
  \frac{d^2\theta}{dt^2}+\frac{g}{L}\cdot \theta=0  \\
  \MyDownarrow \nonumber \\
 \theta=\theta_{\mathrm{max}}\cdot \operatorname{sen}(\omega \cdot t+\varphi) \\
 \MyDownarrow \nonumber \\
 \omega=\sqrt{\frac{g}{L}} \\
 \MyDownarrow \nonumber \\
  T=\frac{2\cdot \pi}{\omega} \\
 \MyDownarrow \nonumber \\
  T=2\cdot \pi \cdot\sqrt{\frac{L}{g}}
\end{gather}


Para ángulos $>$10º se usa el desarrollo de taylor del seno.

\section{But just replacing figure with center and removing the scopes}


Y finalmente, como el seno para ángulos $<$10º se puede sustituir por el ángulo:
\begin{equation}
  \frac{d^2\theta}{dt^2}+\frac{g}{L}\cdot \theta=0
\end{equation}
\begin{center}
\begin{tikzpicture}[thick,>=latex,->]
  \draw[->] (0,0) -- (0,-0.4);
\end{tikzpicture}
\end{center}
\begin{equation}
 \theta=\theta_{\mathrm{max}}\cdot \operatorname{sen}(\omega \cdot t+\varphi)
\end{equation}
\begin{center}
\begin{tikzpicture}[thick,>=latex,->]
  \draw[->] (0,0) -- (0,-0.4);
\end{tikzpicture}
\end{center}
\begin{equation}
 \omega=\sqrt{\frac{g}{L}}
\end{equation}
\begin{center}
\begin{tikzpicture}[thick,>=latex,->]
  \draw[->] (0,0) -- (0,-0.4);
\end{tikzpicture}
\end{center}
\begin{equation}
 T=\frac{2\cdot \pi}{\omega}
\end{equation}
\begin{center}
    \centering
\begin{tikzpicture}[thick,>=latex,->]
  \draw[->] (0,0) -- (0,-0.4);
\end{tikzpicture}
\end{center}
\begin{equation}
 T=2\cdot \pi \cdot\sqrt{\frac{L}{g}}
\end{equation}


Para ángulos $>$10º se usa el desarrollo de taylor del seno.
\end{document}
