

我认为这个问题会有很多反对票,因为我不知道如何开始,也无法提供足够的源代码。我对 tikz 完全陌生,我想画一个由完全图生成的递归图,$K_n$如图$K_1$所示。它从它开始$K_7$,$K_6$然后围绕它$K_5$,依此类推,直到 $K_1$。我竭尽全力了几个星期,但仍然一无所获。这是我到目前为止得到的“代码”。
\documentclass[tikz]{standalone}
\newcount\recurdepth
\newcount\bil
\usepackage{tikz}

\begin{document}
\begin{tikzpicture}
\draw (0,0)--(1,1);
\def\myrecur#1#2{
    \recurdepth=#2
    \ifnum\the\recurdepth>2\relax
        \pgfmathtruncatemacro{\batas}{#2-1}
        \begin{scope}[shift=(#1.north west)]
            \foreach \i in {0,...,\batas}{
                \advance\bil by 1
                \node[draw,circle] (v\i) at (\i*360/#2:1.4*\recurdepth){\i};
                \advance\recurdepth by-1\relax
                \myrecur{v\i}{\the\recurdepth};
            }
        \end{scope}
    \fi
}

\node[draw,circle,fill] (v0) at (0,0){};
\myrecur{v0}{5}
\end{tikzpicture}
\end{document}

答案1
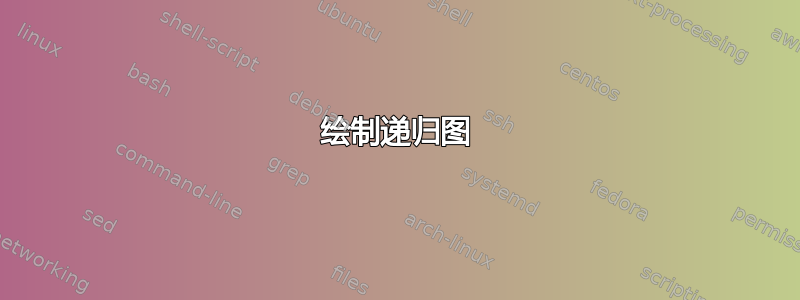
这更像是 LaTeX3 解决方案。要绘制此图表,您需要调用该\graph_recursive_draw:nnn函数。我只尝试了 N=7,这已经很慢了。您可以更改参数来调整图表的外观。
下面的图像是使用 InkScape 从 PDF 文件生成的。它包含太多对象,InkScape 可能出现错误。因此,它无法反映 PDF 的外观。

\documentclass{standalone}
\usepackage{tikz}
\usepackage{expl3}


\begin{document}

\ExplSyntaxOn

\int_new:N \g_polygon_id_int
\int_gset:Nn \g_polygon_id_int {1}
\int_new:N \g_polygon_vertex_int
\int_gset:Nn \g_polygon_vertex_int {1}

\tl_new:N \l_graph_tmpa_tl
\tl_new:N \l_graph_tmpb_tl
\tl_new:N \l_graph_tmpc_tl
\tl_new:N \l_graph_tmpd_tl
\tl_new:N \l_graph_tmpe_tl
\tl_new:N \l_graph_tmpf_tl

\int_new:N \l_graph_tmpa_int
\int_new:N \l_graph_tmpb_int

\fp_new:N \l_graph_tmpa_fp
\fp_new:N \l_graph_tmpb_fp
\fp_new:N \l_graph_tmpc_fp
\fp_new:N \l_graph_tmpd_fp
\fp_new:N \l_graph_tmpe_fp
\fp_new:N \l_graph_tmpf_fp
\fp_new:N \l_graph_tmpg_fp

% defines how much the side length shrinks between levels
\fp_new:N \g_graph_radius_shrink_fp
\fp_gset:Nn \g_graph_radius_shrink_fp {0.3}
% defines the distance between levels
% it is measured in multiples of radius
\fp_new:N \g_graph_distance_fp
\fp_gset:Nn \g_graph_distance_fp {5.5}
% defines how much the distance shrinks between levels
\fp_new:N \g_graph_distance_shrink_fp
\fp_gset:Nn \g_graph_distance_shrink_fp {0.5}
% defines how much the line width shrinks between levels
\fp_new:N \g_graph_line_width_shrink_fp
\fp_gset:Nn \g_graph_line_width_shrink_fp {0.6}

\cs_set:Npn \graph_polygon_param_csname:n #1 {
    __g_polygon_param_\int_to_alph:n {#1}_tl
}


\tl_new:N \l_graph_x_tl
\tl_new:N \l_graph_y_tl
% extract x, y coordiantes from a TikZ coordinate
% #1: coordinate name
\cs_set:Npn \graph_extract_xy:n #1 {
    \path (#1);
    \pgfgetlastxy{\l_graph_x_tl}{\l_graph_y_tl};
    % unit conversion (in cm)
    \tl_set:Nx \l_graph_x_tl {\dim_to_decimal_in_unit:nn {\l_graph_x_tl} {1cm}}
    \tl_set:Nx \l_graph_y_tl {\dim_to_decimal_in_unit:nn {\l_graph_y_tl} {1cm}}
}

% define a polygon
% the polygon id is given by the value of \g_polygon_id_int before function call
% the parameter of each polygon would be saved in the command name generated by \graph_polygon_param_csname:n
% #1: number of sides
% #2: center x
% #3: center y
% #4: radius
% #5: rotation
\cs_set:Npn \graph_define_polygon:nnnnn #1#2#3#4#5 {
    % save parameters
    \tl_new:c {\graph_polygon_param_csname:n {\g_polygon_id_int}}
    \tl_gset:cx {\graph_polygon_param_csname:n {\g_polygon_id_int}} {
        {#1}{#2}{#3}{#4}{#5}
    }
    % save starting vertex index
    \tl_gput_right:cx {\graph_polygon_param_csname:n {\g_polygon_id_int}} {
        {\int_use:N \g_polygon_vertex_int}
    }
    % define coordinates
    \int_step_inline:nnn {0} {#1 - 1} {
        \coordinate (vertex-\int_use:N \g_polygon_vertex_int) at (
            \fp_eval:n {(#4) * cos((##1/#1) * 2 * \c_pi_fp + 0.5 * \c_pi_fp + (#5)) + #2},
            \fp_eval:n {(#4) * sin((##1/#1) * 2 * \c_pi_fp + 0.5 * \c_pi_fp + (#5)) + #3}
        );
        \int_gincr:N \g_polygon_vertex_int
    }
    \int_gincr:N \g_polygon_id_int
}

\cs_generate_variant:Nn \graph_define_polygon:nnnnn {xxxxx}

% define the subpolygon of a polygon given id
% the number of subpolygons would depend on the number of sides of the given polygon
% new polygons are defined using \graph_define_polygon:nnnnn
% #1: polygon id
\cs_set:Npn \graph_define_subpolygon:n #1 {
    % get number of sides
    \int_set:Nn \l_graph_tmpa_int {\tl_item:cn {\graph_polygon_param_csname:n {#1}} {1}}
    % get center position
    \fp_set:Nn \l_graph_tmpa_fp {\tl_item:cn {\graph_polygon_param_csname:n {#1}} {2}}
    \fp_set:Nn \l_graph_tmpb_fp {\tl_item:cn {\graph_polygon_param_csname:n {#1}} {3}}
    % get radius
    \fp_set:Nn \l_graph_tmpc_fp {\tl_item:cn {\graph_polygon_param_csname:n {#1}} {4}}
    % compute new radius
    \fp_set:Nn \l_graph_tmpd_fp {\l_graph_tmpc_fp * \g_graph_radius_shrink_fp}
    % compute new distance factor
    \fp_set:Nn \l_graph_tmpe_fp {\g_graph_distance_fp * \g_graph_distance_shrink_fp}
    % get rotation angle
    \fp_set:Nn \l_graph_tmpf_fp {\tl_item:cn {\graph_polygon_param_csname:n {#1}} {5}}

    % compute new rotation angle offset
    \int_compare:nNnTF {\l_graph_tmpa_int} = {4} {
        \fp_set:Nn \l_graph_tmpg_fp {\l_graph_tmpf_fp}
    } {
        \fp_set:Nn \l_graph_tmpg_fp {
            \l_graph_tmpf_fp + \c_pi_fp / (\l_graph_tmpa_int - 1)
        }
    }

    % get vertex strating index
    \tl_set:Nx \l_graph_tmpa_tl {\tl_item:cn {\graph_polygon_param_csname:n {#1}} {6}}

    % define new polygons
    \int_step_inline:nnn {0} {\l_graph_tmpa_int - 1} {
        % acquire position of this vertex
        \exp_args:Nx \graph_extract_xy:n {vertex-\int_eval:n {\l_graph_tmpa_tl + ##1}}
        \graph_define_polygon:xxxxx
            {\int_eval:n {\l_graph_tmpa_int - 1}}
            {\fp_eval:n {\l_graph_tmpa_fp + ((\l_graph_x_tl) - (\l_graph_tmpa_fp)) * \l_graph_tmpe_fp}}
            {\fp_eval:n {\l_graph_tmpb_fp + ((\l_graph_y_tl) - (\l_graph_tmpb_fp)) * \l_graph_tmpe_fp}}
            {\fp_use:N \l_graph_tmpd_fp}
            {\fp_eval:n {
                    \l_graph_tmpg_fp + 2 * \c_pi_fp * (##1) / \l_graph_tmpa_int
                }
            }
    }
}

% draw the polygon
% #1: polygon id
\cs_set:Npn \graph_draw_polygon:n #1 {
    % get number of sides
    \tl_set:Nx \l_graph_tmpa_tl {\tl_item:cn {\graph_polygon_param_csname:n {#1}} {1}}
    % get vertex strating index
    \tl_set:Nx \l_graph_tmpb_tl {\tl_item:cn {\graph_polygon_param_csname:n {#1}} {6}}

    % connect lines
    \int_step_variable:nnNn {\l_graph_tmpb_tl} {\l_graph_tmpb_tl + \l_graph_tmpa_tl - 1} \l_graph_tmpc_tl {
        \int_step_variable:nnNn {\l_graph_tmpb_tl} {\l_graph_tmpb_tl + \l_graph_tmpa_tl - 1} \l_graph_tmpd_tl {
            \int_compare:nNnT {\l_graph_tmpd_tl} > {\l_graph_tmpc_tl} {
                \draw[line~width=\g_cur_linewidth_dim] (vertex-\l_graph_tmpd_tl) -- (vertex-\l_graph_tmpc_tl);
            }
        }
    }
}


% connect the vertices of a polygon and its subpolygon
% #1: polygon id
% #1: starting id of subpolygons
\cs_set:Npn \graph_connect_subpolygon:nn #1#2 {
    % get vertex strating index of main polygon
    \tl_set:Nx \l_graph_tmpa_tl {\tl_item:cn {\graph_polygon_param_csname:n {#1}} {6}}
    % get number of sides
    \tl_set:Nx \l_graph_tmpb_tl {\tl_item:cn {\graph_polygon_param_csname:n {#1}} {1}}
    \int_step_variable:nnNn {\l_graph_tmpa_tl} {\l_graph_tmpa_tl + \l_graph_tmpb_tl - 1} \l_graph_tmpc_tl {
        % get number of sides of corresponding subpolygon
        \tl_set:Nx \l_graph_tmpd_tl {
            \tl_item:cn {\graph_polygon_param_csname:n {#2 + \l_graph_tmpc_tl - \l_graph_tmpa_tl}} {1}
        }
        % get starting index of corresponding subpolygon
        \tl_set:Nx \l_graph_tmpe_tl {
            \tl_item:cn {\graph_polygon_param_csname:n {#2 + \l_graph_tmpc_tl - \l_graph_tmpa_tl}} {6}
        }
        \int_step_variable:nnNn {\l_graph_tmpe_tl} {\l_graph_tmpe_tl + \l_graph_tmpd_tl - 1} \l_graph_tmpf_tl {
            \draw[line~width=\g_cur_linewidth_dim] (vertex-\l_graph_tmpc_tl) -- (vertex-\l_graph_tmpf_tl);
        }
    }
}


\tl_new:N \l_resursive_tmpa_tl
\tl_new:N \l_resursive_tmpb_tl
\tl_new:N \l_resursive_tmpc_tl
\tl_new:N \l_resursive_tmpd_tl
\dim_new:N \g_cur_linewidth_dim

% a recursive function to draw the graph
% #1: polygon index
\cs_set:Npn \__graph_recursive_draw:n #1 {
    % use a group to protect local variables across recursive calls
    \group_begin:
        % get number of sides
        \tl_set:Nx \l_resursive_tmpa_tl {\tl_item:cn {\graph_polygon_param_csname:n {#1}} {1}}
        \int_compare:nNnT {\l_resursive_tmpa_tl} > {3} {
            % save starting polygon index
            \tl_set:Nx \l_resursive_tmpb_tl {\int_use:N \g_polygon_id_int}
            % generate subpolygons for this polygon
            \graph_define_subpolygon:n {#1}
            % draw subpolygons and connect them
            \int_step_inline:nnn {\l_resursive_tmpb_tl} {\l_resursive_tmpb_tl + \l_resursive_tmpa_tl - 1} {
                \graph_draw_polygon:n {##1}
            }
            \exp_args:NnV \graph_connect_subpolygon:nn {#1} \l_resursive_tmpb_tl
            % reduce line width
            \dim_gset:Nn \g_cur_linewidth_dim {
                \fp_use:N\g_graph_line_width_shrink_fp \g_cur_linewidth_dim
            }
            % call this function recursively for each subpolygon
            \int_step_inline:nnn {\l_resursive_tmpb_tl} {\l_resursive_tmpb_tl + \l_resursive_tmpa_tl - 1} {
                \__graph_recursive_draw:n {##1}
            }
        }
    \group_end:
}

% a recursive function to draw the graph (user version)
% #1: number of sides
% #2: starting radius
% #3: starting line width
\cs_set:Npn \graph_recursive_draw:nnn #1#2#3 {
    \dim_gset:Nn \g_cur_linewidth_dim {#3}
    % define a new polygon
    \graph_define_polygon:nnnnn {#1}{0}{0}{#2}{0}
    % draw the polygon
    \exp_args:Nx \graph_draw_polygon:n {\int_eval:n {\g_polygon_id_int - 1}}
    % call recursive draw
    \exp_args:Nx \__graph_recursive_draw:n {\int_eval:n {\g_polygon_id_int - 1}}
}

\begin{tikzpicture}
    \graph_recursive_draw:nnn {7}{2}{0.8pt}
\end{tikzpicture}
\ExplSyntaxOff

\end{document}
(编辑:我刚刚意识到小多边形的旋转偏离了 180 度。有时间的时候可能会修复它。)
答案2

上图是递归的结果,只下降了 5 步,从 7 到 3。编译需要 30 秒。(我没有勇气去 2)。我知道这幅图并不是你想要的,但很容易添加缺失的字符串(见下文)。
该程序基于
descending创建递归的修饰(称为)。它有三个参数:多边形的顶点数、递归步骤和界限(最大步骤数)。如果注释掉第一个
for循环,您就可以看到递归的图形结构。
当然,你也可以改为
\draw在\path构造字符串时(才能调用修饰符)得到下图。
至于你问题中出现的字符串,如果你真的需要它们,你可以在类似于第一个的循环中构造它们。对于步骤中的正多边形的当前顶点n(比如说米顶点),你需要考虑连接到它的下一个多边形的所有顶点米-1顶点。
代码
\documentclass[11pt, margin=1cm]{standalone}
\usepackage{tikz}
\usetikzlibrary{math, calc, decorations.markings}
\begin{document}

\tikzmath{
  real \r, \da;
  \r = 3;
}
\tikzset{
  descending/.style n args={3}{%
    decoration={markings,
      mark=at position 1 with {
        code={
          \tikzmath{
            \da = 180/(#1);
            \c = \r*pow(.33, #2);
            for \i in {0, ..., #1}{
              {
                \draw[black, thick]
                ({\i*360/(#1)+\da}: \c/2) -- ({(\i+1)*360/(#1)+\da}: \c/2);
              };
            };
            for \i in {1, ..., #1}{
              if #2<#3 then {
                {
                  \path[gray, thin, descending={#1-1}{#2+1}{#3}]
                  (0, 0) -- ({\i*360/(#1)+\da}: \c);
                };
              } else {
                {
                  \draw[]
                  (0, 0) -- ({\i*360/(#1)+\da}: {\r*pow(.33, #2)});
                };
              };
            };
          }
        }
      }
    },
    postaction=decorate
  }
}

\begin{tikzpicture}
  \path[descending={7}{0}{4}] (0, 0) -- (0.1, 0);
\end{tikzpicture}

\end{document}