

有人知道如何在乳胶中绘制这张地图吗?

答案1
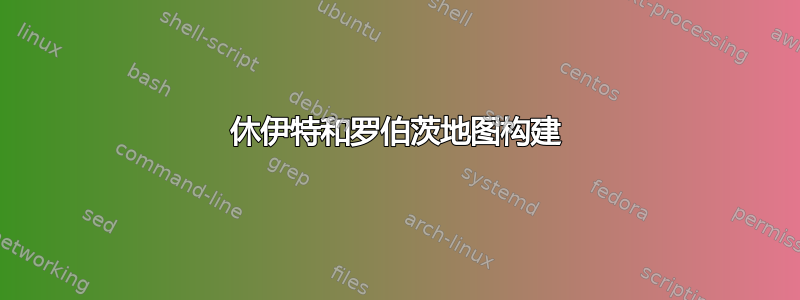
一种有用的方法是将“地图”作为 包含node在 中tikzpicture,然后跟踪它。轴是使用 的loglogaxis环境绘制的。段边界和标签使用和命令pgfplots插入。包括图片并跟踪它可以更轻松地找到贝塞尔曲线的正确控件。\draw\node

\documentclass[tikz,border=3pt]{standalone}
\usepackage{pgfplots}

\begin{document}

\tikzset{every node/.append style={font=\bfseries\Large}}
\pgfplotsset{compat=newest}

\begin{tikzpicture}
% Include the Hewitt and Roberts map as a node
%\node[] (A) at (0,0) {\includegraphics[width=20cm]{HR.png}};

% Draw the axes - both on the log scale
\begin{loglogaxis}[
at={(0.25,0.5)}, % this aligns the axes with the image
anchor=center,
xmin=1,
xmax=100000,
ymin=1,
ymax=10000,
width=17.2cm, % make the width the same as the imported image
height=13.5cm, % make the width the same as the imported image
enlargelimits=false,
ticklabel style={font=\huge\bfseries},
xlabel={liquid},
ylabel={gas},
ylabel style={rotate=-90}
]
\end{loglogaxis}

% Draw the boundaries
\draw[line width=3pt] (3.6,6.6) .. controls (1.9,5.6) and (1.9,4.4) .. (1.9,1.3);
\draw[line width=3pt] (-7.4,2.3) .. controls (-4.1,1.2) and (-3.5,1.2) .. (8,1.3);
\draw[line width=3pt] (3.9,1.3) .. controls (3.7,-2.7) and (4.4,-3.1) .. (6.5,-4.1);
\draw[line width=3pt] (3.9,0.5) .. controls (1.2,0.4) and (-1.3,-0.8) .. (-3.4,-4.5);

% Label the segments
\node at (-2.5,4) {Annular flow};
\node at (5,3.4) {Whispy annular};
\node at (-3.3,-0.9) {Churn flow};
\node at (1.2,-3.2) {Baby slug flow};
\node at (6.2,-0.6) {Bubble flow};

\end{tikzpicture}

\end{document}