

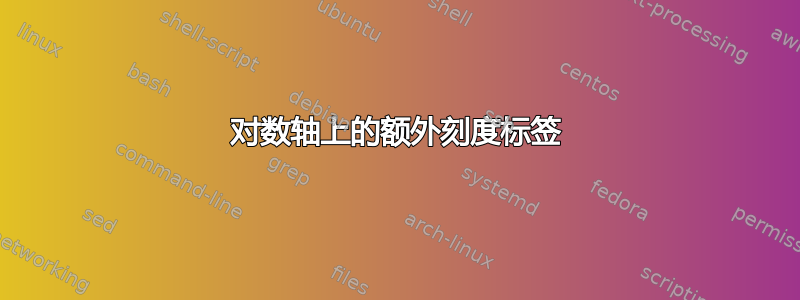
有人能解释一下如何以十进制而不是指数形式获取额外的 x 刻度标签吗?

我的代码如下:
\documentclass{beamer}
\usepackage[utf8]{inputenc}
\usepackage[english]{babel}
\usepackage{pgfpages}
%\pgfpagesuselayout{4 on 1}[a4paper, border shrink=3mm, landscape]
\usepackage{siunitx}
\usepackage{tikz}
\usepackage{pgfplots}
\usepackage{amssymb,amsmath}
\sisetup{detect-all}
\pgfplotsset{compat=1.18}

%\usetheme{CambridgeUS}
%\usecolortheme{Spruce}

\title{Sieve Analysis Results}
\date{\today}
\institute{ABC}

\begin{document}
\begin{frame}
    \titlepage
\end{frame}

\begin{frame}{Particle Size Distribution}
    \begin{figure}
    \fontsize{7}{8}\selectfont
        \begin{tikzpicture}
            %\draw [step=0.5, color=black!50!white, very thin] (0,0) grid (10.5,7.5);
            \begin{semilogxaxis}
            [   xmin=0.001,
                width=0.9\textwidth,
                height=0.7\textheight,
                xmax=200,
                ymin=0,
                ymax=100,
                grid=both,
                extra x tick style={font=\fontsize{5}{5}\selectfont},
                extra x ticks={2},
                extra y ticks={10,30,50,70,90},
                %,$0.2$,$0.6$,$2.36$,$6$,$60$,$200$},
                xlabel={Sieve Size (mm)},
                ylabel={Percent Passing},
                log ticks with fixed point,
            ]\addplot[line width=0.75pt, color=red!90!black, mark=*, mark size=1.25pt, smooth] table {sieve.dat};
            \end{semilogxaxis}
        \end{tikzpicture}
    \end{figure}
\end{frame}
\end{document}
图表数据如下:
| 筛孔尺寸(mm) | 通过率 |
|---|---|
| 13.2 | 100 |
| 9.50 | 99 |
| 6.7 | 97 |
| 4.75 | 96 |
| 2.36 | 93 |
| 1.18 | 90 |
| 0.60 | 88 |
| 0.425 | 87 |
| 0.30 | 86 |
| 0.15 | 84 |
| 0.075 | 80 |
谢谢
答案1
看来,添加就log identify minor tick positions=false可以extra tick style解决问题。
% used PGFPlots v1.18.1
\documentclass[border=5pt]{standalone}
\usepackage{pgfplots}
    \pgfplotsset{compat=1.18}
\begin{document}
\begin{tikzpicture}
    \begin{semilogxaxis}[
        xmin=0.001,
        xmax=200,
        ymin=0,
        ymax=100,
        log ticks with fixed point,
        extra x ticks={2},
        extra tick style={
            log identify minor tick positions=false,
        },
    ]
    \end{semilogxaxis}
\end{tikzpicture}
\end{document}
