

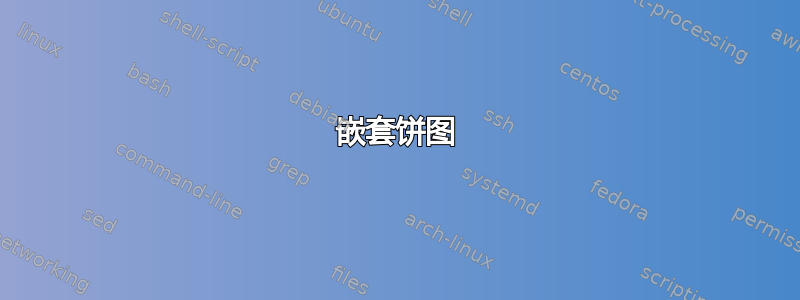
我知道我问的太多了。但是碰巧有人知道一个能够在 Latex 中绘制嵌套饼图的包吗?像这样:

附言:这更多的是好奇而不是真正的需要,Python 在这方面做得很好 ;)
答案1
以下答案使用轮图包,是我写的。
定义一个命令\WCtest,其输出取决于百分比是否大于 1。此命令用于键data和wheel data。
使用键gap={\WCpercentage>1?0.03:0},如果百分比大于 1,则会在切片之间创建间隙。否则,不会创建间隙。
图例由键决定legend。这是一个tabular放置在 中的\node。行由键决定legend row。可以使用 获得所有行的结果\WClegend。
\wheelchart每个环使用单独的环。

\documentclass[border=6pt,dvipsnames]{standalone}
\usepackage{wheelchart}
\usepackage{siunitx}
\sisetup{text-family-to-math}
\begin{document}
\begin{tikzpicture}
\sffamily
\def\WCtest#1#2{\pgfmathparse{\WCpercentage>1?"#1":"#2"}\pgfmathresult}
\pgfkeys{
  /wheelchart,
  data=\WCtest{}{\qty{\WCvarA}{\percent}},
  data style=gray,
  gap={\WCpercentage>1?0.03:0},
  gap radius=0.03,
  start angle=0,
  wheel data=\WCtest{\qty{\WCvarA}{\percent}}{},
  wheel data pos=0.5
}
\wheelchart[
  legend row={\tikz\fill[\WCvarB] (0,0) rectangle (0.3,0.3); & \WCvarC},
  legend={
    \node[anchor=east] at (-5,0) {%
      \begin{tabular}{rl}%
      \WClegend%
      \end{tabular}%
    };
  },
  middle=District AAL:\\\textcolor{gray}{Rs $12.9$ L},
  radius={1.5}{3},
  wheel data style=white
]{%
  43.1/Cerulean/Residential Buildings,
  24/Green/Economic Sectors,
  22.1/Red/Critical Buildings,
  10.8/gray/Transportation Infrastructure%
}
\wheelchart[
  radius={3}{4},
  wheel data style=gray
]{%
  20.9/Cerulean!50,
  16.2/Cerulean!30,
  6.02/Cerulean!10,
  9.59/Green!50,
  9.33/Green!30,
  5.11/Green!10,
  16.4/Red!50,
  5.7/Red!30,
  10.6/gray!50,
  0.221/gray!30%
}
\end{tikzpicture}
\end{document}