

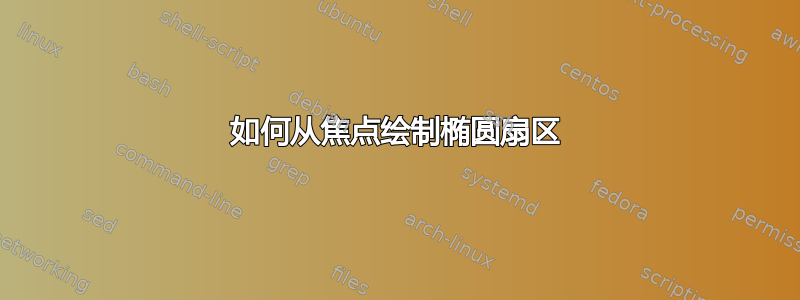

如何使用这段最少的代码从焦点绘制椭圆的扇区
我尝试了很多方法,但都没有成功。请帮助我。:)
\documentclass[tikz]{standalone}
\usepackage{tikz}
\usetikzlibrary{calc}

\begin{document}
\begin{tikzpicture}[dot/.style={draw,fill,circle,inner sep=1pt}, scale=0.75, transform shape,every node/.style={scale=1.5}]

\def\a{5} % semi-eixo maior
\def\b{4} % semi-eixo maior
\draw[thick,blue] (\a,\b) ellipse ({\a} and {\b});

\node[blue,dot,label={below:$F_1$}] (F1) at ({\a-sqrt(\a*\a-\b*\b)},\b) {};
\node[blue,dot,label={below:$F_2$}] (F2) at ({\a+sqrt(\a*\a-\b*\b)},\b) {};

\end{tikzpicture}
\end{document}
答案1

\documentclass[tikz,border=3.14mm]{standalone}

\usetikzlibrary{calc}

\begin{document}

\begin{tikzpicture}[
    dot/.style={draw,fill,circle,inner sep=1pt},
    scale=0.75,
    transform shape,
    every node/.style={scale=1.5}]

    \def\a{5} % semi-eixo maior
    \def\b{4} % semi-eixo maior

    \draw[thick, blue] (-\a,0) arc[
        start angle = 180,
        end angle = -180,
        x radius = \a,
        y radius = \b]
        ;

    \node[blue,dot,label={below:$F_1$}] (F1) at ({-sqrt(\a*\a-\b*\b)},0) {};
    \node[blue,dot,label={above:$F_2$}] (F2) at ({+sqrt(\a*\a-\b*\b)},0) {};

    \def\e{150} \def\f{110}
    \coordinate (E) at (\e: \a cm and \b cm);
    \coordinate (F) at (\f: \a cm and \b cm);
    \fill[orange, opacity=.5] (F1) -- (E) arc [start angle = \e, end angle = \f,    x radius = \a, y radius = \b] -- (F1) -- cycle;
    \node[dot, red] at (E) {};
    \node[dot, red] at (F) {};


    \def\e{-20} \def\f{-120}
    \coordinate (E) at (\e: \a cm and \b cm);
    \coordinate (F) at (\f: \a cm and \b cm);
    \fill[purple, opacity=.5] (F2) -- (E) arc [start angle = \e, end angle = \f,    x radius = \a, y radius = \b] -- (F2) -- cycle;
    \node[dot, red] at (E) {};
    \node[dot, red] at (F) {};
\end{tikzpicture}


\end{document}
答案2
另一种方法:
\documentclass[tikz]{standalone}
\usepackage{tikz}
\usetikzlibrary{calc,math}


\tikzmath{
\a=5;
\b=4;
\c=sqrt(1-(\b/\a)^2); % distance from center to focal points
\th1=170; % start angle
\th2=120; % end angle
\th3=-60; % start angle
\th4=-30; % end angle
}
\begin{document}
\begin{tikzpicture}[
dot/.style={draw,fill,circle,inner sep=1pt}, scale=0.75, %transform shape,
every node/.style={scale=1.5}]

\begin{scope}[x=\a cm,y=\b cm,radius=1]
\draw[thick,blue]  circle;

\coordinate(F1) at(-\c,0);
\coordinate(F2) at(\c,0);


\fill[red](F1)--(\th1:1)arc[start angle=\th1, end angle=\th2]--cycle;

\fill[blue](F2)--(\th3:1)arc[start angle=\th3, end angle=\th4]--cycle;

\node[blue,dot,label={below:$F_1$}] at(F1) {}; \node[blue,dot,label={above:$F_2$}] at(F2) {};
\end{scope}
\end{tikzpicture}
\end{document}
