

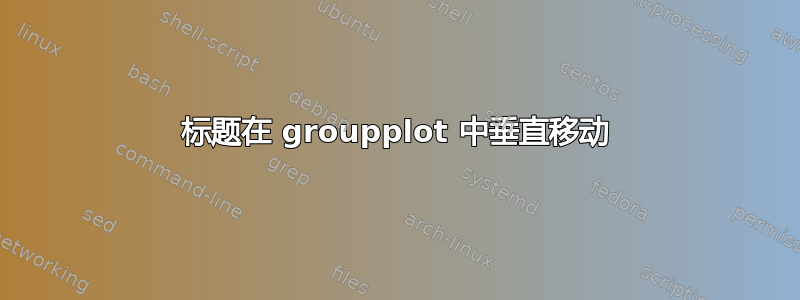
我正在使用 groupplot 在 中创建不连续性y-axis。但是,当我应用该axis x line=top命令时,标题会向下移动,如所附屏幕截图所示。
有人知道如何修复它吗?这是我使用的代码的一部分
\begin{figure}[t!]
\centering
\begin{tikzpicture}
\begin{groupplot}[group style={group size=1 by 2,vertical sep=0pt}]

\nextgroupplot[enable tick line clipping=false,
    ymode=log,
    width=6cm,
    height=4.5cm,
    axis line style=thick,
    axis on top=true,
    x tick style={draw=none},
    axis x line=bottom,
    xmin=1,xmax=5,
    xticklabels={,,},
    y tick style={black,thick},
    y label style={at=(ticklabel cs:0),anchor=near ticklabel},
    ymin=2e8,ymax=10^10,
    ytick={10^9,10^10},
    axis y discontinuity=parallel,
    ytick pos=left,
    ytick align=outside,
    ylabel={resistance [\SI{}{\ohm}]},
]
    \addplot [red,thick,y=y,x=x] table {
    x       y
    1       3e9
    5       3e9
    };


\nextgroupplot[enable tick line clipping=false,
    ymode=log,
    width=6cm,
    height=4.5cm,
    axis line style=thick,
    axis x line=bottom,
    axis on top=true,
    x tick style={black,thick},
    x label style={at=(ticklabel cs:0.5),anchor=near ticklabel},
    xmin=1,xmax=5,
    xtick={1,2,...,5},
    xtick pos=bottom,
    xtick align=outside,
    xlabel={volume [\SI{}{\ml}]},
   y tick style={black,thick},
%    y label style={at=(ticklabel cs:0.5),anchor=near ticklabel},
    ymin=10^3,ymax=3e4,
    ytick={10^3,10^4},
    ytick pos=left,
    ytick align=outside,
%    ylabel={resistance [\SI{}{\ohm}]},
]
    \addplot [only marks,mark=*,mark options={scale=1.8,fill=blue!30},y=y,x=x] table {
    x       y
    1       10200
    2       5730
    3       3610
    4       3030
    5       2790
    };

\end{groupplot}
\end{tikzpicture}
\caption{Lateral resistance of a single compliant electrode at different volumes of the SWCNT dispersion sprayed.}
\label{fig:resist}
\end{figure}

答案1
正如评论中提到的,似乎ymode=log、axis x line=bottom (或top)和的组合axis discontinuity会导致在图表底部添加大量额外的空白。第一个轴上的ymin/ymax设置使情况变得更糟。标题与问题无关,它被添加到它应该在的位置,就在 下方tikzpicture。问题是tikzpicture太大了。添加
\draw (current bounding box.south east) rectangle (current bounding box.north west);
之前\end{tikzpicture}看到过。但不知道到底是什么原因造成的。我已报告https://github.com/pgf-tikz/pgfplots/issues/432
与此同时,你可以手动绘制不连续符号,例如在顶部轴的每个下角group name=P添加group style并绘制一条线double
\draw [double, thick, double distance=3pt] (P c1r1.south west) ++(-8pt, 0) -- +(16pt,0);
\draw [double, thick, double distance=3pt] (P c1r1.south east) ++(-8pt, 0) -- +(16pt,0);
axis discontinuity从轴选项中删除该选项。

\documentclass[tikz]{article}
\usepackage{pgfplots,siunitx}
\usepgfplotslibrary{groupplots}
\pgfplotsset{compat=1.18}
\begin{document}
\begin{figure}
\centering
\begin{tikzpicture}
\begin{groupplot}[
  group style={
     group size=1 by 2,
     vertical sep=0pt,
     group name=P
     }
  ]

\nextgroupplot[enable tick line clipping=false,
    ymode=log,
    width=6cm,
    height=4.5cm,
    axis line style=thick,
    axis on top=true,
    x tick style={draw=none},
    axis x line=top,
    xmin=1,xmax=5,
    xticklabels={,,},
    y tick style={black,thick},
    y label style={at=(ticklabel cs:0),anchor=near ticklabel},
    ymin=2e8,ymax=10^10,
    ytick={10^9,10^10},
%    axis y discontinuity=parallel,
    ytick pos=left,
    ytick align=outside,
    ylabel={resistance [\SI{}{\ohm}]},
]
    \addplot [red,thick,y=y,x=x] table {
    x       y
    1       3e9
    5       3e9
    };


\nextgroupplot[
    enable tick line clipping=false,
    ymode=log,
    width=6cm,
    height=4.5cm,
    axis line style=thick,
    axis x line=bottom,
    axis on top=true,
    x tick style={black,thick},
    x label style={at=(ticklabel cs:0.5),anchor=near ticklabel},
    xmin=1,xmax=5,
    xtick={1,2,...,5},
    xtick pos=bottom,
    xtick align=outside,
    xlabel={volume [\SI{}{\ml}]},
   y tick style={black,thick},
    y label style={at=(ticklabel cs:0.5),anchor=near ticklabel},
    ymin=10^3,ymax=3e4,
    ytick={10^3,10^4},
    ytick pos=left,
    ytick align=outside,
%    ylabel={resistance [\SI{}{\ohm}]},
]
    \addplot [only marks,mark=*,mark options={scale=1.8,fill=blue!30},y=y,x=x] table {
    x       y
    1       10200
    2       5730
    3       3610
    4       3030
    5       2790
    };

\end{groupplot}

\draw [double, thick, double distance=3pt] (P c1r1.south west) ++(-8pt, 0) -- +(16pt,0);
\draw [double, thick, double distance=3pt] (P c1r1.south east) ++(-8pt, 0) -- +(16pt,0);
\draw (current bounding box.south east) rectangle (current bounding box.north west);
\end{tikzpicture}
\caption{Lateral resistance of a single compliant electrode at different volumes of the SWCNT dispersion sprayed.}
\label{fig:resist}
\end{figure}
\end{document}