

我如何绘制这些凸集、严格凸集和非凸集?

答案1
这是一个起点。如果你想这样做,你可能需要了解贝塞尔曲线。

\documentclass{article}
\usepackage{tikz}

\tikzset{
    convexset/.style = {line width = 0.75 pt, fill = orange},
    ext/.style = {circle, inner sep=0pt, minimum size=2pt, fill=black},
    segment/.style = {line width = 0.75 pt}
        }
\begin{document}
    \begin{tikzpicture}
        \draw[convexset]
                (0,0) .. controls + (0.2,2) and + (-0.2,1) ..
                (2,1) .. controls + (0.2,-0.5) and + (0.5,0) ..
                (1.2,-3) .. controls + (-0.5,0) and + (-0.1,-1) ..
                (0,0) -- cycle;
        \draw[segment] (1,-1) node[ext]{} -- (1.5,1) node[ext]{};
    \end{tikzpicture}%
    \hspace*{2cm}%
    \begin{tikzpicture}[scale=0.75]
        \draw[convexset]
                (0,0) .. controls + (0.2,0) and +(-1,0) ..
                (2,-2) .. controls + (1,0) and + (-0.2,0) ..
                (4,0) .. controls + (0.2,0) and + (1,0) ..
                (2,-7) .. controls + (-1,0) and + (-0.2,0) ..
                (0,0) -- cycle;
        \draw[segment] (0.5,-1.5) node[ext]{} -- (3.5,-1.5) node[ext]{};
    \end{tikzpicture}
\end{document}
编辑:如何完成
您可以在下面看到曲线是如何绘制的。这些点是贝塞尔曲线。请注意,这里我使用了控制点的相对定位(controls + (-1,0)即将控制点放置在曲线锚点左侧 1 厘米处)。


答案2
只是为了好玩。
生产阶段
\documentclass[pstricks,border=12pt]{standalone}
\begin{document}
\begin{pspicture}[showgrid=false](0.75,0)(9.5,4)
    \psset{fillstyle=solid,fillcolor=gray}
    % left
    \pscustom{\psparabola(1,1)(2,3)\closepath}
    \qdisk(1.5,1){2pt}
    \qdisk(2.5,1){2pt}
    % middle
    \psccurve(5,0.5)(4,1.5)(5,3.5)(6,1.5)
    \qdisk(5,1.5){2pt}
    \qdisk(5,2.5){2pt}
    \psline(5,1.5)(5,2.5)
    % right
    \psccurve(7,3.5)(8,2.8)(9,3.5)(8,0.5)
    \qdisk(7,3){2pt}
    \qdisk(9,3){2pt}
    \psline(7,3)(9,3)
\end{pspicture}
\end{document}

开发阶段
在开发过程中,您需要通过 来启用网格showgrid=true。

答案3
TikZ 命令controls对于绘制贝塞尔曲线非常方便
\draw (A) .. controls +(<out angle> : <out force>) and +(<in angle> : <in force>) .. (B);
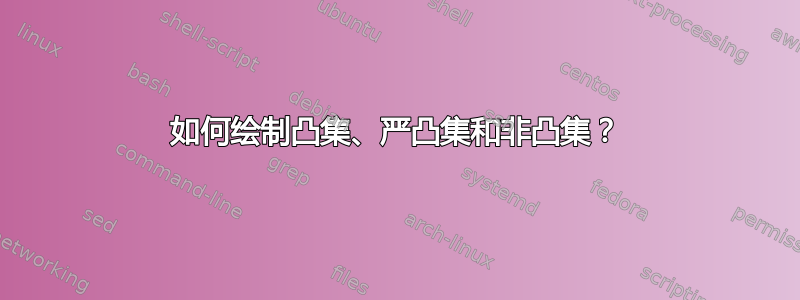
请注意,这里不需要对称性,所以我没有尝试平滑右侧块的右上角。

\documentclass[border=5mm]{standalone}
%\documentclass{article}
\usepackage{tikz}
\begin{document}
\begin{tikzpicture}
\tikzset{dot/.style={circle,fill,inner sep=1.5pt}}

\begin{scope}[local bounding box=L]  % the left
\def\a{1.5}
\draw[fill=green!50]
(-\a,0) .. controls +(75:3) and +(105:3).. (\a,0) --cycle;
\path (.6*\a,0) node[dot]{} (-.6*\a,0) node[dot]{};
\end{scope}

\begin{scope}[local bounding box=C,shift={(3,1)}]     % the center
\draw[fill=orange!50]
(0,-1.5) .. controls +(170:.5) and +(180:2) ..
(.5,2) .. controls +(0:1.2) and +(0:.5) .. cycle;
\draw (0,0) node[dot]{} -- (.3,1.5) node[dot]{};
\end{scope}

\begin{scope}[local bounding box=R,shift={(6,1)}]   % the right
\def\b{1}
\draw[fill=yellow!50,rounded corners=2mm]
(\b,2.5) .. controls +(-95:5) and +(-85:5) ..
(-\b,2.5) .. controls +(-60:2) and +(-120:2) ..
cycle        % I like that! Symmetry is not necessary here
%(\b,2.5)    % I like that too
;
\draw (.75,1.6) node[dot]{} -- (-.75,1.6) node[dot]{};
\end{scope}

% for legends
\path
(C.south)+(0,-.7) node (M) {strictly convex}
(L.south|-M) node{convex}
(R.south|-M) node{non-convex};
\end{tikzpicture}

\end{document}
附言:尝试使用 Asymptote 来获得乐趣。在我看来,它不如 TikZ 方便。

// Run on http://asymptote.ualberta.ca/
unitsize(1cm);
path Bezierpath(pair A, pair At, pair Bt, pair B){
return A..controls A+At and B+Bt ..B;
}
real a=1.5;
path convex=Bezierpath((-a,0),3dir(75),3dir(105),(a,0));
filldraw(convex -- cycle,.5purple+white);
dot((.6a,0)^^(-.6a,0));

shipout(bbox(5mm,invisible));