

我想创建一个表格,其中有些行是多列的,其中一行填充长文本,后面跟着 2 列的行。创建多列或在典型列中插入长文本没有任何问题,但当我使用 \multicolumn 函数时,我的文本溢出并弄乱了我的表格。
我使用了以下代码:
\documentclass{article}
\usepackage{booktabs}
\usepackage{tabu}
\usepackage[utf8]{inputenc}
\usepackage[autostyle]{csquotes}
\usepackage{graphicx}
\usepackage{longtable}
\usepackage{float}
\usepackage{graphicx}
\usepackage{lscape}
\usepackage[margin=1in]{geometry}
 \usepackage{authblk}
\usepackage{times}
\usepackage{url}
\usepackage{hyperref}
\usepackage[utf8]{inputenc}
\usepackage[autostyle]{csquotes}
\usepackage{caption}
\usepackage{amsmath}
\usepackage{ltablex,booktabs}
\usepackage[title]{appendix}

\newcolumntype{C}{>{\arraybackslash}X}
\newlength{\twocolwidth}
\setlength\twocolwidth{\dimexpr1\hsize+\tabcolsep+\arrayrulewidth}

\newcommand{\source}[1]{\vspace{-1pt}{\hfill \footnotesize{Source: {#1}} } }

\newcolumntype{b}{X}
\newcolumntype{s}{>{\hsize=.2\hsize}X}
\newcolumntype{m}{>{\hsize=.4\hsize}X}

\usepackage{xcolor}
\hypersetup{
    colorlinks,
    linkcolor={red!50!black},
    citecolor={blue!50!black},
    urlcolor={blue!80!black}
}


\topmargin 0.0cm
\oddsidemargin 0.2cm
\textwidth 16cm
\textheight 21cm
\footskip 1.0cm

\counterwithin{figure}{section}
\counterwithin{table}{section}
\renewcommand\thefigure{\thesection\arabic{figure}}
\renewcommand\thetable{\thesection\arabic{table}}


{\footnotesize
 \begin{tabularx}{\textwidth}[h!]{| X | X |}
 \caption{Description of the selected algorithms\label{TABLEA}}\\

 \hline
 \multicolumn{2}{| c |}{Begin of Table}\\
 \hline
Algorithm & General Operation \\
 \hline
 \endfirsthead

 \hline
 \multicolumn{2}{| c |}{Continuation of Table \ref{TABLEA}}\\
 \hline
Algorithm & General Operation \\
 \hline
 \endhead

 \hline
 \endfoot

 \hline
 \multicolumn{2}{| c |}{End of Table}\\
 \hline
 \endlastfoot

\multicolumn{2}{| c |}{\textbf{Agglomerative methods}} \\
\hline
\multicolumn{2}{|>{\hsize=\twocolwidth}C c |}{The notion of distance in this family makes it possible to identify cliques through relational proximities } \\
   \hline

 \hline
           \textbf{Hierarchical algorithm} with 4 different settings:  Euclidean distance / Complete linkage; Euclidean distance / Ward; Manhattan distance / Complete linkage; Manhattan distance / Ward.
           & The basic idea is to construct the hierarchical relationship among data in order to cluster. Each data point stands for an individual cluster in the beginning, and then, the most neighboring two clusters are merged into a new one until there is only one cluster left. The concept of "neighborhood" depends on the distance between nodes which is computed by squaring the Euclidean or Manhattan distances and grouping them into a symmetric matrix. The clustering method (here, complete linkage and Ward's algorithm) identifies the closest nodes to agglomerate them. We obtain a hierarchical dendogram which is cut to the desired number of clusters. \\


 \end{tabularx}
}


\end{document}
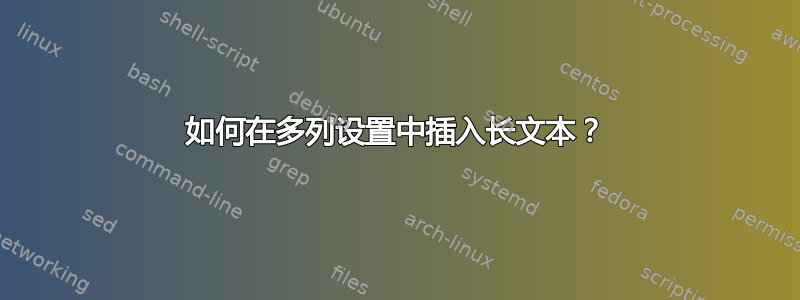
但正如您在此处看到的,文本出现了双重:

并且表格变得比我的页面还大。
有人知道如何解决这个问题吗?
PS:我只是一个使用 Overflow 的初学者,所以我不知道代码的哪一部分产生了这个问题
答案1
- 目前尚不清楚您的表格应该是什么样子。
- 到目前为止,这还很不寻常。例如,你喜欢在表头中用“表开头”和“表结尾”来表示什么?
- 该包的使用
ltablex可能会比较棘手。 - 软件包
tabu有缺陷且无人维护。不要使用它。请尝试使用相对较新、功能强大的软件包tabularray。 - 您需要清理文档序言:
- 每个包应该只加载一次
- 包
hyperref应该最后加载(极少数例外情况是您的文档中不存在) - 您真的需要所有这些包吗?
- 您应该意识到长表只能在行之间拆分,而不能在页之间拆分。
longtblr使用包的表格的一个例子tabularray是,其中一些行重复,表格足够长,可以跨越两页,如下所示:
\documentclass{article}
\usepackage[margin=1in]{geometry}
\usepackage{tabularray}
\UseTblrLibrary{booktabs}  % it load package booktabs,
                            % so delete its other loads

\begin{document}
\noindent\begin{longtblr}[
caption={Description of the selected algorithms},
  label={TABLEA}        ]{hlines, vlines,
                         colspec={*2{X[j]}},
                         row{1} = {c, font=\bfseries},
                         rowhead=2,
                         hspan=minimal}
% table body
Algorithm       & General Operation     \\
\SetCell[c=2]{c,font=\bfseries}    Agglomerative methods
                &                       \\
\SetCell[c=2]{c}    The notion of distance in this family makes it possible to identify cliques through relational proximities
                &                       \\
\textbf{Hierarchical algorithm} with 4 different settings:  Euclidean distance / Complete linkage; Euclidean distance / Ward; Manhattan distance / Complete linkage; Manhattan distance / Ward.
                &   The basic idea is to construct the hierarchical relationship among data in order to cluster. Each data point stands for an individual cluster in the beginning, and then, the most neighboring two clusters are merged into a new one until there is only one cluster left. The concept of "neighborhood" depends on the distance between nodes which is computed by squaring the Euclidean or Manhattan distances and grouping them into a symmetric matrix. The clustering method (here, complete linkage and Ward's algorithm) identifies the closest nodes to agglomerate them. We obtain a hierarchical dendogram which is cut to the desired number of clusters. \\
\end{longtblr}
\end{document}
笔记:
- 表格经过修改,具有通常在表格中使用的形式。
- 在序言中仅加载与该表相关的包。

答案2
插入\parbox。\multicolumn它将以与常规段落类似的方式格式化文本,最重要的是,它会在必要时添加换行符。默认情况下,它是对齐的,因此您可能需要添加\centering等\raggedright来格式化文本。
我还在\strut文本开头添加了,这样行就可以稍微延伸,从而在上面形成一个小的垂直间隙。如果您想要更大的间隙,请添加不可见的条。例如,在文本开头插入
\rule{0pt}{12pt}
并在文本末尾附加
\rule[-6pt]{0pt}{6pt}
最后,\parbox需要一个强制参数:宽度。在您的例子中,这是文本主体的宽度减去表格中的规则和列分隔符所占用的空间量。
这是有问题的表格部分\multicolumn

\documentclass{article}
\usepackage{tabularx}
\begin{document}
{\noindent
\begin{tabularx}{\textwidth}{| *2{X|}}
    \hline
    \multicolumn{2}{| c |}{Begin of Table} \\
    \hline
    Algorithm & General Operation \\
    \hline
    \multicolumn{2}{| c |}{End of Table} \\
    \hline
    \multicolumn{2}{| c |}{\textbf{Agglomerative methods}} \\
    \hline
    \multicolumn{2}{| c |}{%
        \parbox{\dimexpr\textwidth-2\tabcolsep-2\arrayrulewidth}{\strut
        The notion of distance in this family makes it possible to identify cliques through relational proximities}
    } \\
    \hline
\end{tabularx}\par}
\end{document}