

(不知道如何在这个论坛上写数学表达式)。我正在尝试绘制以下函数
\begin{align*}
       f : [0,1] &\longrightarrow \RE, \\
              x  &\mapsto \begin{cases} x, &x \in \{ 0,1\}\\ s_k, &\text{for } x \in (s_{k - 1}, s_k] \end{cases}
   \end{align*}
在 Tikz 中。以下是我目前所拥有的:
\begin{tikzpicture}
\begin{axis}[
axis x line=middle, axis y line=middle,
ymin=0, ymax=1, ytick={0,0.25,...,0.75}, ylabel=$f(x)$,
xmin = 0,xmax=1, xtick={0,0.25,...,0.75}, xlabel=$x$,
legend pos=north west,legend style={draw=none}
]
\addplot[domain=0:0.5]{0.5};
\addplot[domain=0.5:0.75]{0.75};
\addplot[domain=0.75:0.875]{0.825};
%\addplot[domain=0:0.5]{0.5};
\end{axis}
理想情况下,我会按以下方式在代码中编写它:
var s = 0;

for i = 1, i <= 10, i++ {
    s' = s;
    s += 2^{-i};
    \addplot[domain=s':s]{s}
}
这样我就能得到想要的结果。但我不知道如何将其转换为 Tikz...欢迎任何帮助!
答案1
您也可以在 PGFPlots 中使用伪编码循环。
\foreach您需要使用\pgfplotsforeachungrouped或而不是PGF/TikZ \pgfplotsinvokeforeach,因为 PGFPlots 不会立即处理其图。
代码
\documentclass[tikz]{standalone}
\usepackage{pgfplots}
\pgfplotsset{compat=1.18}
\begin{document}
\begin{tikzpicture}
\begin{axis}[
axis x line=middle, axis y line=middle,
ymin=0, ymax=1, ytick={0,0.25,...,0.75}, ylabel=$f(x)$,
xmin = 0,xmax=1, xtick={0,0.25,...,0.75}, xlabel=$x$,
legend pos=north west,legend style={draw=none}
]
\pgfmathsetmacro\domainEnd{0}                      % s = 0
\pgfplotsforeachungrouped \i in {1, ..., 10}{
  \let\domainStart\domainEnd                       % s' = s
  \pgfmathsetmacro\domainEnd{\domainStart+2^(-\i)} % s += 2^{-i}
  \addplot[domain=\domainStart:\domainEnd] {\domainEnd};
}
\end{axis}
\end{tikzpicture}
\end{document}
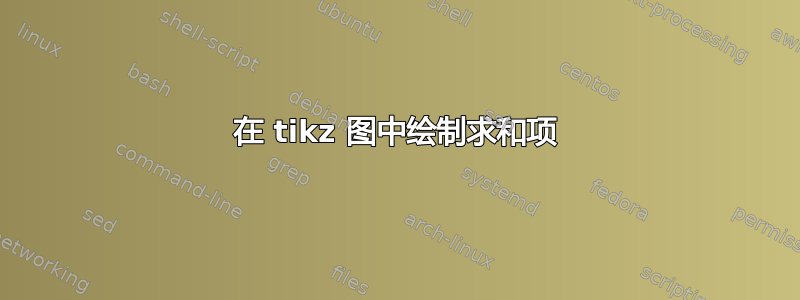
输出

答案2
pgfmath无需代码的替代方案
\documentclass[tikz, border=1cm]{standalone}
\usepackage{pgfplots}
\pgfplotsset{compat=1.18}
\begin{document}
\begin{tikzpicture}
\begin{axis}[
axis lines=center,
xmin=0, xmax=1,
ymin=0, ymax=1,
xlabel=$x$, ylabel=$f(x)$,
xtick distance=0.25, ytick distance=0.25,
enlargelimits=0.1,
]
\foreach \i in {1,...,10}
\addplot[domain={1-2^(-\i+1)}:{1-2^-\i}]{1-2^(-\i)};
\end{axis}
\end{tikzpicture}
\end{document}
