

这与我发布的另一个问题相关(圆形和椭圆形周围的阴影)。由于我只得到了部分答案,所以我想发布一个更具体的提问,看看是否能弄清楚其余的问题。
我有一组非线性方程组,可以得出椭圆内有一个圆。可行区域在圆内和椭圆外。我在上一个问题中找到了圆内阴影的满意答案,将在下面的答案中显示。
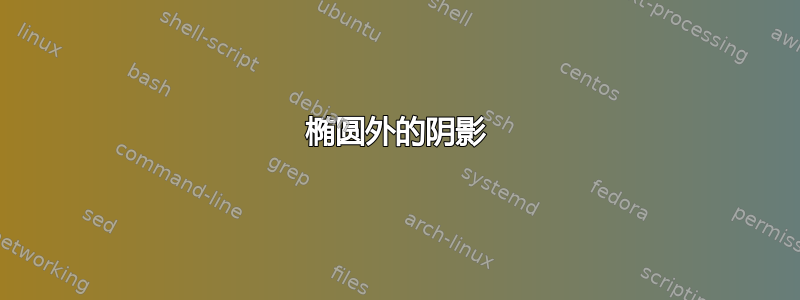
我还想将结果扩展到椭圆外部的阴影。我想说清楚,对周围的矩形(整个轴)使用填充绘制是行不通的(因为我已经能够实现它),因为它会给轴数字留下“模糊感”。
我更愿意在 axis 环境中工作,并保持函数定义不变。这将为将来的示例提供一种更灵活的方法。
本质上,线性方程组的解决方法是在轴的顶部或底部创建一条路径,并在 fillbetween 中使用它们。我希望在这里得到类似的结果。
下图显示了我当前的图片。您可以看到提到的“模糊”。我希望该区域不被阴影覆盖。
\documentclass[border=10pt]{standalone}
\usepackage{amsmath,amsthm}
\usepackage{tikz,pgfplots}     %for graphics
\pgfplotsset{compat = newest}     %to run newest version
\usepgfplotslibrary{fillbetween}
\usepackage{xcolor}

\begin{document}
\pagestyle{empty}

\pagecolor{green}

\begin{tikzpicture}
\begin{axis}[
  xmin=-6, xmax=6, ymin=-6, ymax=6,
  axis lines=middle,
  ticklabel style={font=\tiny},
   xtick = {-5,-4,...,5},
  ytick = {-5,-4,...,5},
  xlabel = \(x\),
  ylabel = \(y\),
    legend style={legend pos=north east,font=\tiny}
]

\addplot[name path = A,
   domain=-pi:pi,
   samples=200]({5*sin(deg(x))}, {3*cos(deg(x))});
\addlegendentry{\(\frac{x^{2}}{25} + \frac{y^{2}}{9} = 1\)}

\addplot[name path = B,
   domain=-pi:pi,
   samples=200]({3*sin(deg(x))}, {3*cos(deg(x))});
\addlegendentry{\(x^{2} + y^{2} = 9\)}

\path[name path = C] (0,0) -- (0,0);

    \addplot[only marks,black] coordinates {(0,3) (0,-3)};

      \filldraw[blue!70,opacity=0.4] (-6,-6) rectangle (6,6);

        \filldraw[green,opacity=0.4] (0,0) ellipse (5 and 3);

    \addplot[blue!70,opacity=0.4] fill between [of=B and C];
\end{axis}
\end{tikzpicture}

\end{document}

答案1
如果你不想让填充覆盖轴,那么请使用选项axis on top。无需使用图层(显式)opacity或fillbetween。
\documentclass[tikz, border=1cm]{standalone}
\usepackage{pgfplots}
\pgfplotsset{compat=1.18}
\begin{document}
\begin{tikzpicture}
\begin{axis}[
xmin=-6, xmax=6,
ymin=-6, ymax=6,
axis lines=middle,
ticklabel style={font=\tiny},
xtick={-5,-4,...,5},
ytick={-5,-4,...,5},
xlabel=\(x\), ylabel=\(y\),
legend style={legend pos=north east, font=\tiny},
axis on top,
]
\fill[green!40, even odd rule]
   (current axis.south west) rectangle (current axis.north east)
   plot[domain=-pi:pi, samples=50, smooth] ({5*sin(deg(\x))}, {3*cos(deg(\x))}) -- cycle
   plot[domain=-pi:pi, samples=50, smooth] ({3*sin(deg(\x))}, {3*cos(deg(\x))}) -- cycle;
\addplot[domain=-pi:pi, samples=50, smooth]({5*sin(deg(x))}, {3*cos(deg(x))});
\addlegendentry{\(\frac{x^{2}}{25} + \frac{y^{2}}{9}=1\)};
\addplot[domain=-pi:pi, samples=50, smooth]({3*sin(deg(x))}, {3*cos(deg(x))});
\addlegendentry{\(x^{2} + y^{2}=9\)}
\addplot[only marks] coordinates {(0,3) (0,-3)};
\end{axis}
\end{tikzpicture}
\end{document}

答案2
也许使用图层和剪辑会适合您:
\documentclass[border=10pt]{standalone}
\usepackage{amsmath,amsthm}
\usepackage[dvipsnames]{xcolor}
\usepackage{pgfplots}
\usepgfplotslibrary{fillbetween}
\pgfplotsset{compat=newest}
\pagecolor{Dandelion!20}
\begin{document}
\begin{tikzpicture}
  \begin{axis}[
        xmin=-6, xmax=6, ymin=-6, ymax=6,
        axis lines=middle,
        ticklabel style={font=\tiny},
        xtick = {-5,-4,...,5},
        ytick = {-5,-4,...,5},
        xlabel = \(x\),
        ylabel = \(y\),
        legend style={legend pos=north east,font=\tiny},
        layers/my layer set/.define layer set={
          pre main,
          main}{},
        set layers=my layer set,
      ]
    \addplot[
        name path=A,
        domain=-pi:pi,
        samples=200
      ]({5*sin(deg(x))}, {3*cos(deg(x))});
    \addlegendentry{\(\frac{x^{2}}{25} + \frac{y^{2}}{9} = 1\)}
    \addplot[
        name path=B,
        domain=-pi:pi,
        samples=200
      ]({3*sin(deg(x))}, {3*cos(deg(x))});
    \addlegendentry{\(x^{2} + y^{2} = 9\)}
    \path[name path = C] (0,0) -- (0,0);
    \addplot[only marks,black] coordinates {(0,3) (0,-3)};
    \addplot[blue!30] fill between [of=B and C];
    \begin{pgfonlayer}{pre main}
      \clip (-6,-6) rectangle (6,6) (0,0) ellipse (5 and 3);
      \fill[blue!30] (-6,-6) rectangle (6,6);
    \end{pgfonlayer}
  \end{axis}
\end{tikzpicture}
\end{document}
