

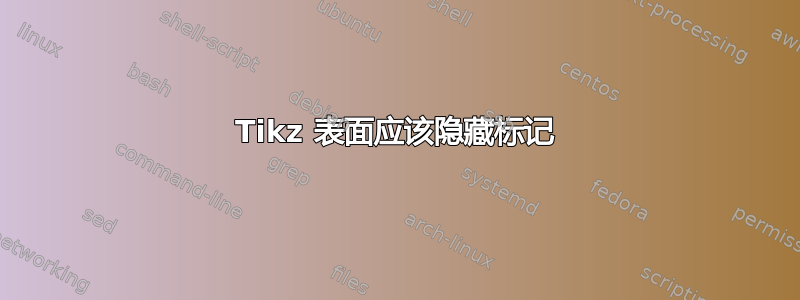
我想重新创建我最初在 Matlab 中绘制的图。它是一个不透明的表面,上面有额外绘制的线条(包括标记)。
我想要使用隐藏和未隐藏的标记重新创建的 matlab 图片:

从视点来看,这些标记中有些位于表面“下方”,有些位于表面“上方”。我也希望这种差异在 Latex 中可见,但我不知道该怎么做。我尝试使用不同的层“剪辑模式=个体”,但所有点都被隐藏了。
乳胶表面:

乳胶中的剪辑模式为“单独”的表面:

我知道它与 Matlab 中的数据集略有不同,但通过 view={0}{0},我可以验证某些点应该位于表面之上,某些点也应该位于表面之下。
希望我的问题能够被理解,如果有人能帮助我,我将非常感激。
我尝试使用以下代码:
\begin{figure}
        \centering
\begin{tikzpicture}
\begin{axis}[height = 10cm,
            width = 0.8\textwidth,
            axis x line*=bottom,
            axis y line*=left,
            view={20}{20},
   clip mode=individual,
            grid=both]

  \addplot3+[]table[x=y1, y=x, z=z1 ]{data/TsurfLines.txt};
  \addlegendentry{Row 1}
  \addplot3+[]table[x=y2, y=x, z=z2 ]{data/TsurfLines.txt};
  \addlegendentry{Row 2}
  \addplot3+[]table[x=y3, y=x, z=z3 ]{data/TsurfLines.txt};
  \addlegendentry{Row 3}
  \addplot3+[]table[x=y4, y=x, z=z4 ]{data/TsurfLines.txt};
  \addlegendentry{Row 4}
  \addplot3+[]table[x=y5, y=x, z=z5 ]{data/TsurfLines.txt};
  \addlegendentry{Row 5}
  \addplot3[surf,shader=interp,opacity=0.7] file {data/Tsurf.txt};
  \addlegendentry{Model}

\end{axis}
\end{tikzpicture}
\caption{...}
\end{figure}
答案1
PGFPlots 没有将 az 缓冲区扩展到单个图之外,因此您需要手动操作才能完成。您可以自己选择点,或者如果您有阈值或公式,则可以使用如下过滤器:
\documentclass[tikz, border=1cm]{standalone}
\usepackage{pgfplots}
\pgfplotsset{compat=1.18}
\begin{document}
\begin{tikzpicture}
\begin{axis}[
view={20}{20},
xmin=0, xmax=1,
ymin=0, ymax=1,
zmin=0, zmax=1,
clip mode=individual,
]
\addplot3[
only marks, domain=0.01:1, samples=10, samples y=1,
z filter/.expression={0.2+0.1*sin(1000*y)<0.2?z:nan},
] (0.5,x,{0.2+0.1*sin(1000*x)});
\addplot3[surf, shader=interp, opacity=0.8, domain=0.01:1, samples=100, samples y=2] (x,y,{(x-1)^2-0.01/x});
\addplot3[
only marks, domain=0.01:1, samples=10, samples y=1,
z filter/.expression={0.2+0.1*sin(1000*y)>0.2?z:nan},
] (0.5,x,{0.2+0.1*sin(1000*x)});
\end{axis}
\end{tikzpicture}
\end{document}
