

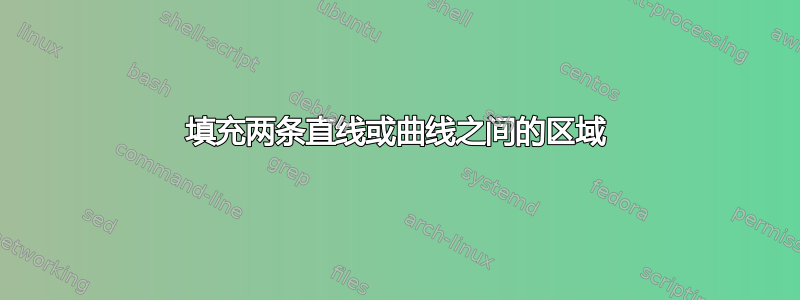
我想填充图片中标记的区域(蓝色),我没有成功,这是我的尝试
\documentclass{article}
\usepackage{tikz,amsmath, amssymb,bm,color}
\usepackage[margin=0cm,nohead]{geometry}
\usepackage[active,tightpage]{preview}
\usetikzlibrary{shapes,arrows}
\usepackage{pgfplots}% loads also tikz
\pgfplotsset{compat=newest}
\usetikzlibrary{intersections,calc, pgfplots.fillbetween}
\PreviewEnvironment{tikzpicture}

\begin{document}
\begin{tikzpicture}[>=latex,scale=0.7]

\coordinate (O) at (-10,0) ;
\coordinate (A) at (-8.5,1.5) {};
\coordinate (B) at (3,2.5) {};
\coordinate (end) at (6,3.7) {};
\draw[name path=curve,thick] (3.5,0) .. controls (3.5,5) and (4.5,6.5) .. (end);
\path[name path=line1,thick] (4.7,0) --+ (90:6);
\path[name path=line2,thick] (end) --+ (160:6);
\draw[thick,name path=line3] (O) to [out=15,in=170,thick](3.5,0);
\path [name intersections={of=curve and line1,by=E}];
\path [name intersections={of=curve and line2,by=Q}];
\draw[thick,name path=line5] (end)--(Q);
\draw[thick,name path=line4] (O) to [out=90,in=170](E);
\tikzfillbetween[of=line3 and line4]{ball color=gray!50,opacity=0.1};
\end{tikzpicture}
\end{document}

答案1
例如这样:
\documentclass[border=10pt]{standalone}
\usepackage{pgfplots} % loads also tikz
\pgfplotsset{compat=newest}
\usetikzlibrary{fillbetween}

\begin{document}
\begin{tikzpicture}[scale=0.7]

\coordinate (O) at (-10,0);
\coordinate (end) at (6,3.7);

\path[name path=curve1] (3.5,0) .. controls (3.5,5) and (4.5,6.5) .. (end);
\path[name path=curve2] (O) to[out=15, in=170] (3.5,0);
\path[name path=line1] (4.7,0) -- +(90:6);
\path[name path=line2] (end) -- +(160:6);

\path[name intersections={of=curve1 and line1, by=E}];
\path[name path=curve3] (O) to[out=90, in=170] (E);

\path[name path=curve4,
    intersection segments={of=curve2 and curve3, sequence={L* -- R*[reverse]}}];
\fill[gray, draw=black, thick,
    intersection segments={of=curve1 and curve4, sequence={R1 -- L2 -- R3}}] -- cycle;

\fill[gray!50, draw=black, thick,
    intersection segments={of=curve1 and line2, sequence={L2 -- R2}}] -- cycle;

\end{tikzpicture}
\end{document}

一些评论:
- 正如代码中的注释所述,已
pgfplots加载tikz。因此无需再次加载。我还从代码中删除了此示例不需要的其他包、库、宏和选项。 - 您的代码中没有使用坐标
A和,因此我将其删除。B - A
\coordinate不接受花括号中的参数{}(unline a\node)。 - 该选项仅对与选项 一起
thick产生影响。\pathdraw - 我实际上只绘制并填充了最后的路径。因此,绘制从
end到 的短线的代码Q不再必要。 - 我重命名了路径,但请随意使用其他名称。