

需要针对特定主题绘制如下的图表,目的是创建一个模板,以便其他图表能够轻松创建。
有一些必要条件
- 无需介意颜色或具体位置。
tikz-external库并且babel-portuguese是必需的,所以答案不应该与这些相冲突。
以下是一些想法
- 最好使用自动定位来
graphs创建命名节点作为顶点,以便它们可用于标签的相对定位。
通过下列方法可以非常轻松地研究tikz-graphs骨架:
\documentclass{standalone}

% Needed
\usepackage[portuguese]{babel} % Babel

% Tikz
\usepackage{tikz}
\usetikzlibrary{
    babel,
    external, % needed
    graphs, graphdrawing,
    arrows.meta,
}
\usegdlibrary{layered}

% External setup
\tikzexternalize[
    up to date check={simple}, % faster check
    figure list=true, % generate list of figures file
]
\tikzsetfigurename{figure.\arabic{part}.\arabic{section}.} % set figure names

% Tikz graphs style
\tikzstyle{mygraphsstyle}=[
    % Arrows
    > ={Stealth[round,sep]},
    shorten > =3pt,
    shorten < =3pt,
]

% Graphs style
\tikzset{
    % Graphs style
    graphs/every graph/.append style={
        nodes={circle,draw,fill,fill opacity=0.1},
        layered layout,
        grow'=right,
        level distance=6em,
        sibling sep=6ex,
    },
}

\begin{document}

\tikzset{external/remake next=true} % remake next graph
\begin{tikzpicture}[mygraphsstyle]
    \graph{
        % Layers
        {[same layer] 4};
        {[same layer] 6,5,7};
        {[same layer] 8,9};
        {[same layer] 10,11,12};

        % Graph
        1 -> 2 -> 3 -> 4 -> {6,5,7};
        6 -> 8 -> 10 -> 13;
        7 -> 9 -> 12 -> 13;
        5 -> 7;
        5 ->[dashed] 8;
        9 -> 11 ->[dashed] 12;
    };
\end{tikzpicture}

\end{document}
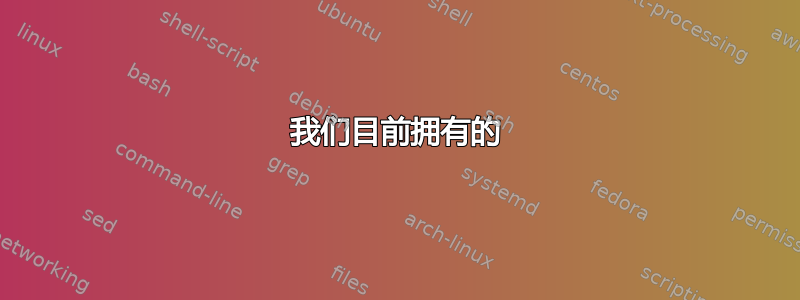
我们目前拥有的

目标形象

答案1
在我看来,如果某些东西看起来像一个节点矩阵,那么通常更容易将它们定位成这样,而不是强制某些 Lua 算法来执行此操作。
这里我使用matrix of single node graphs安装\tmng在每个非空单元格开始处的具有以下参数规范:
|<注释选项>|<左注释>:<右注释>:[<节点选项>]<图形规范>;
其中|<annot options>|,[<node options>]arg 是可选的。
这意味着单元格输入
|below| 37: 38: [yshift=-2em] 11;
将转变为
\graph{11[yshift=-2em, annot={below}{37}{38}]};
其中设置为生成具有两个条目(此处和)的形状annot的标签。 处的 不是路径末尾的通常的 ,但它同样重要,省略它会破坏所有内容。rectangle split3738;;
这并不一定需要graph单元格内的库/语法,但在涉及空间时它会变得更加宽松。
代码
\documentclass[tikz]{standalone}
\usepackage[portuguese]{babel}
\usetikzlibrary{arrows.meta, babel, graphs, shapes.multipart, quotes}
\tikzset{
  annotation/.style={
    draw=red, shape=rectangle split, rectangle split horizontal, rectangle split parts=2},
  annot/.style n args={3}{label={[direction shorthands,annotation,#1]{#2\nodepart{two}#3}}},
  matrix of single node graphs/.style={
    matrix, graphs/every graph/.append style={#1}, execute at begin cell=\tmng}}
\usepackage{xparse} % argment type u needs package
\NewDocumentCommand{\tmng}{D||{} u: u: O{} u;}
  {\graph[no placement]{#5[#4,annot={#1}{#2}{#3}]};}
\begin{document}
\tikz[>={Stealth[round, sep]}, thick, node font=\sffamily]
  \matrix[
    matrix of single node graphs={
      nodes={
        circle, draw=blue, fill=blue!25, align=center, text width=width("00")}},
    label distance=+.5ex,
    row sep={2cm,between origins},
    column sep={2cm,between origins}]{
      & & & &        22:26: 6;
      &              29:33: 8;
      &              38:42:10; \\
        |below|       0: 0: 1;
      & |below|       2: 2: 2;
      & |below|       6: 6: 3;
      & |above, anchor=south east|
                     16:16: 4;
      & |right|      20:20: 5;
      & &            38:38:12;
      & |below|      44:44:13; \\
      & & &
      & |below|      25:25: 7;
      & |below|      33:33: 9;
      & |below|      37:38:[yshift=-2em]11; \\}
  graph[
    use existing nodes,
    edge={draw=blue},
    edge quotes={auto, execute at begin node=$, execute at end node=$}
  ]{
    1 ->["A_2"]     2
      ->["B_4"]     3
      ->["C_{10}"'] 4
      ->["F_4"]     5
      ->["H_5"]     7
      ->["I_8"]     9
      ->["K_5"]    12
      ->["L_6"]    13,
    4 ->["D_6"]     6
      ->["G_7"]     8
      ->["M_9"]    10
      ->["N_2"]    13,
    4 ->["E_7"']    7,
    5 ->[dashed]    8,
    9 ->["J_4"]    11
      ->[dashed]   12
  };
\end{document}
输出

答案2
这是不使用 的一种方法\graph。它只是您需要的基本内容的草图,并留有调整空间(如给定的)。引入外部化、语言和模板应该不是问题。一些具体内容:
基本思想是\pics像节点一样进行相对定位,并附带一些额外功能:
    \pic                        (A) at (0,0) {el={1/0/0}};
    \pic [right=of A-x]         (B) {el={2/2/2}};
根据tikz 中的‘\pic’ 似乎有必要定义一些用于相对定位的内部节点,这里-x,您可以参考。\pic定义在这里,其中:
\tikzset{
    pics/el/.style args={#1/#2/#3}{% allow parameters
        code={
            % adjust
            \node [draw,circle,minimum width=7mm] (-x) {#1};
            \node [draw,below=2.5mm of -x,anchor=east] {#2};
            \node [draw,below=2.5mm of -x,anchor=west] {#3};
            }
        }
    }
- 传递 3 个参数(
args以您选择的语法) - 提供
code绘图 - 定义内部参考点,在这里
-x - 对圆圈下方的方框进行一些微调
- 您还可以在此处引入形状和文本的颜色,或框的定位标志
#4,其值如下u,b,l,r(但是,我只需传递一个角度或极坐标来定位盒子)
剩下要做的就是为一些连接器提供一些文本标签,如下所示:
\draw [->] (A-x) -- node [above] {$A_2$} (B-x);

\documentclass[10pt,border=3mm,tikz]{standalone}
\usepackage{tikz}
\usetikzlibrary{positioning}


\begin{document}

\tikzset{
    pics/el/.style args={#1/#2/#3}{% allow parameters
        code={
            % adjust
            \node [draw,circle,minimum width=7mm] (-x) {#1};
            \node [draw,below=2.5mm of -x,anchor=east] {#2};
            \node [draw,below=2.5mm of -x,anchor=west] {#3};
            }
        }
    }

 \begin{tikzpicture}
    % ~~~ pics ~~~~~~
    \pic                        (A) at (0,0) {el={1/0/0}};
    \pic [right=of A-x]         (B) {el={2/2/2}};
    \pic [right=of B-x]         (C) {el={3/6/6}};
    \pic [right=of C-x]         (D) {el={4/16/16}};
    \pic [above right=of D-x]   (E) {el={6/22/26}};
    \pic [right=of D-x]         (F) {el={5/20/20}};
    \pic [below right=of D-x]   (G) {el={7/25/25}};

    % ~~~ connectors ~~~~~~~~~
    \draw [->] (A-x) -- node [above] {$A_2$} (B-x);
    \draw [->] (B-x) -- (C-x);
    \draw [->] (C-x) --node [below] {$C_{10}$}  (D-x);
    \draw [->] (D-x) -- (E-x);
    \draw [->] (D-x) -- (F-x);
    \draw [->] (D-x) -- (G-x);
 \end{tikzpicture}

\end{document}