

我刚刚按照这个模板创建了这个热图:https://tikz.net/heatmap/
现在我想定制一些东西:
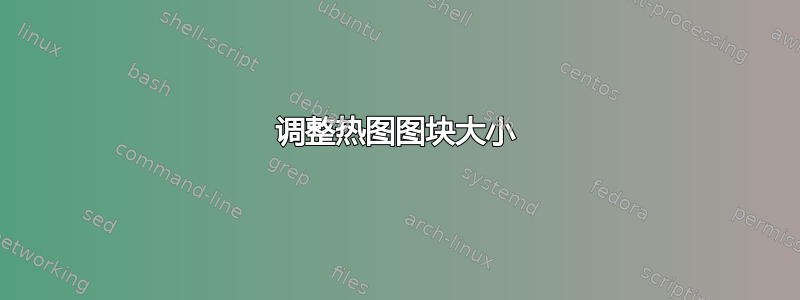
- 如果我将列标签替换为 $j=1$ bsp。那么标签会重叠。如何才能使正方形中的框更大,以便文本能够很好地适应它?
- 不幸的是,由于颜色较小,热度等级不同。我该如何调整它以适合我的值,以便最大为 3?
这是我的代码:
\documentclass[tikz]{standalone}

\begin{document}
\begin{tikzpicture}[scale=0.6]
  \foreach \y [count=\n] in {
{0,1,2,0,0,1,2,1,3,2,1,2,1,1},
{0,1,0,0,1,1,1,1,0,0,0,0,1,0},
{3,1,1,3,2,1,0,1,0,1,2,1,1,2},
    } {

      % heatmap tiles
      \foreach \x [count=\m] in \y {
        \node[fill=purple!\x!yellow, minimum size=6mm, text=white] at (\m,-\n) {\x};
      }
    }

  % row labels
  \foreach \a [count=\i] in {$k=1~~~~~$,$k=2~~~~~$,$k=3~~~~~$} {
    \node[minimum size=6mm] at (0,-\i) {\a};
  }
    \foreach \b [count=\j] in {1,2,3,4,5,6,7,8,9,10,11,12,13,14} {
    \node[minimum size=6mm] at (\j,0) {\b};
  }
\end{tikzpicture}
\end{document}
答案1
缺少使用矩阵或者其他矩阵创建包/工具,我会用它来解决这个问题,而chains根本不需要考虑任何坐标。
通过为几乎所有节点设置一个公共节点,text width我们可以实现统一的输出。
不过,现在图表的宽度是 18 厘米。
text height和 的值text depth所有节点全局设置,以在垂直维度上实现相同的效果。(杰标题中的文字需要注意,否则它们的大小几乎相同。
我添加了两个矩形路径,一个包含整个图表(尽管backgrounds图书馆可能更适合,因为它也有自己的界面来调整填充和样式)以及热图框。
我选择了不同的线条样式来更好地显示它们的重叠。
代码
\documentclass[tikz, border=2mm]{standalone}
\usetikzlibrary{chains}
\begin{document}
\begin{tikzpicture}[
  node distance=+0pt,
  text height=.8em, text depth=+.2em, outer sep=+0pt, align=center,
  box/.style ={text width={width("$j = 00$")}},
  box1/.style={text width={width("$k = 0$")}, align=right},
  start chain=rows going below,
]
\node[on chain, box1]{};
\scoped[start branch=k0 going base right]
  \foreach \b in {1, ..., 14} \node[on chain, box] {$j = \b$};

\foreach \y [count=\n] in {
  {0,1,2,0,0,1,2,1,3,2,1,2,1,1},
  {0,1,0,0,1,1,1,1,0,0,0,0,1,0},
  {3,1,1,3,2,1,0,1,0,1,2,1,1,2}}{
  \node[on chain] {$k = \n$};
  \tikzset{start branch/.expanded=k\n\space going base right}
  \foreach \x [evaluate={
    \xc = \x*100/3;
    \tc = \xc < 33 ? "black" : "white";}] in \y
    \node[fill=purple!\xc!yellow, box, text=\tc, on chain] {\x};
}

\draw[green, ultra thick]
  (current bounding box.south west) rectangle (current bounding box.north east);
\draw[blue]  (rows/k3-2.south west) rectangle (rows/k1-end.north east);
\end{tikzpicture}
\end{document}
输出
