

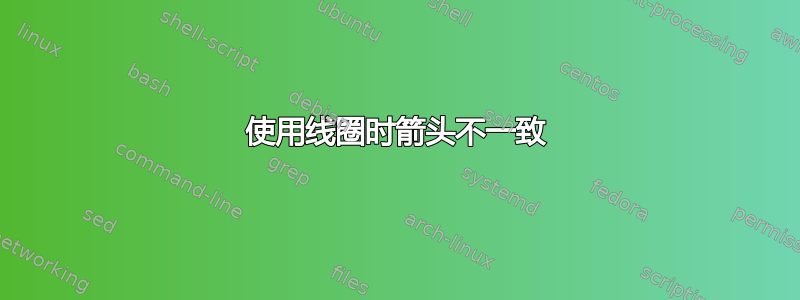
我正在尝试制作下面的图像:

我目前整理的代码如下:
\documentclass[11pt]{book}
\usepackage{amsthm,amssymb}
\usepackage{unicode-math}
\usepackage{tikz}
\usetikzlibrary{arrows.meta,decorations.pathreplacing,decorations.markings}
\usepackage{pgfplots}
\begin{document}
    \begin{figure}
        \centering
        \tikzset{solid node/.style={circle,draw,inner sep=1.2,fill=black},myarrow/.style={scale=1.2,
                decoration={
                    markings,
                    mark=at position 0.3 with {\arrow[scale=1.3]{Latex}}
                },
                postaction={decorate}
            },   myarrow1/.style={
                postaction={
                    decorate,
                    decoration={
                        markings,
                        mark=at position 1 with {\arrow{Latex}}
                    }
                },
                decorate,
                decoration={coil,aspect=0,amplitude=0.8mm,segment length=8mm}
            },
            myarrow2/.style={
                decorate,
                decoration={coil,aspect=0,amplitude=0.6mm,segment length=8mm},
                postaction={
                    decorate,
                    decoration={
                        markings,
                        mark=at position 1 with {\arrow{Latex}}
                    }
                }
            }
        }
        \begin{tikzpicture}
            \node (1) [solid node,label=left:{$1$}] at (0,3){};
            \node (i) [solid node,label=above:{$i$}] at (3,3){};
            \node (j) [solid node,label=left:{$j$}] at (2,0.3){};
            \node (n) [solid node,label=right:{$n$}] at (5,0){};
            \draw[densely dashed,myarrow,bend left=20] (j) to (i);
            \draw[densely dashed,myarrow,bend left=20] (i) to (j);
            \draw[myarrow2] (1) to node[midway, below] {$c$} (i);
            \draw[myarrow1] (j) to node[midway, below] {$c$} (n);
        \end{tikzpicture}
    \end{figure}
     \end{document}
呈现如下图像:

正如您所看到的,指向“i”和“n”的箭头看起来与它们前面的边不一致。这是我的第一个问题。我的第二个问题是我不知道应该如何从“i”到“j”绘制边“b”。任何提示或解决方案都值得赞赏。
答案1
如果移除箭头,您会发现末端有一段短直线段,因为它segment length无法容纳路径长度的整数倍。
然后,PGF 用直线部分填充其余部分,并将箭头放置在直线部分的末端。
我想你想要一个不同的装饰稍加调整,它也可以用于部分路径,允许类似
\draw[->]
  (i.30) arc[radius=1, start angle=90+30, delta angle=-200]
  decorate[coily=-.4mm] { -- (j) };
在这个例子中,选择了delta angle(因此选择了end angle),使得正弦波看似与圆弧相切。
类似的事情也发生在替代方案中
\draw[->] (i)
  (i) to[out=45, in=15, looseness=2] ++(-60:2)
  decorate[coily=-.4mm] { -- (j) };
另外,不要放置箭头at position 1。使用正确的箭头尖端规范。然后,bending库的键flex和flex'也bend能正常工作。
代码
\documentclass[tikz]{standalone}
\usepackage{tikz}
\usetikzlibrary{
  arrows.meta, bending, bbox,
  decorations.pathmorphing, decorations.markings}
% decoration complete sines adjusted
% origin: https://tex.stackexchange.com/a/25689
\pgfdeclaredecoration{complete sines}{initial}{
  \state{initial}[
    width=+0pt, next state=sine,
    persistent precomputation=
      \pgfmathsetlength\pgfdecorationsegmentlength{
        \pgfdecoratedinputsegmentlength/
        int(\pgfdecoratedinputsegmentlength/\pgfdecorationsegmentlength)}]{}
  \state{sine}[width=\pgfdecorationsegmentlength]{
    \pgfpathlineto{\pgfpointorigin}
    \pgfpathsine  {\pgfqpoint{0.25\pgfdecorationsegmentlength}{+0.5\pgfdecorationsegmentamplitude}}
    \pgfpathcosine{\pgfqpoint{0.25\pgfdecorationsegmentlength}{-0.5\pgfdecorationsegmentamplitude}}
    \pgfpathsine  {\pgfqpoint{0.25\pgfdecorationsegmentlength}{-0.5\pgfdecorationsegmentamplitude}}
    \pgfpathcosine{\pgfqpoint{0.25\pgfdecorationsegmentlength}{+0.5\pgfdecorationsegmentamplitude}}}
  \state{final}{}}
\tikzset{
  arr/.style={
    postaction=decorate,
    decoration={
      name=markings, mark=at position #1 with {\arrow[scale=1.3]{Latex}}}},
  coily/.style={
    decorate,
    decoration={name=complete sines, amplitude=#1, segment length=6mm}},
  coily1/.style={coily=0.8mm}, coily2/.style={coily=0.6mm}}
\begin{document}
\foreach \bendmode in {quick, flex, bend}{
  \begin{tikzpicture}[
    solid node/.style={shape=circle, draw, inner sep=1.2pt, fill=black},
    > = Latex,
    arrows = {[\bendmode]}
  ]
  \node (1) [solid node, label= left:{$1$}] at (0,3  ) {};
  \node (i) [solid node, label=above:{$i$}] at (3,3  ) {};
  \node (j) [solid node, label= left:{$j$}] at (2,0.3) {};
  \node (n) [solid node, label=right:{$n$}] at (5,0  ) {};

  \draw[densely dashed, arr=.3, bend left=20] (j) to (i);
  \draw[densely dashed, arr=.3, bend left=20] (i) to (j);
  \draw[->, coily1] (1) to node[midway, below] {$c$} (i);
  \draw[->, coily2] (j) to node[midway, below] {$c$} (n);
  \draw[->] (i)
   (i.30) arc[radius=1, start angle=90+30, delta angle=-200]
   % or as an alternative something like
%   (i) {[bezier bounding box] to[out=45, in=15, looseness=2] ++(-60:2) }
    node[above]{$b$}
    decorate[coily=-.4mm] { -- (j) };
  \path[sloped] (i) -- node {\bendmode} (j);
  \end{tikzpicture}
}
\end{document}
输出

答案2
为了有更多的选择,这里有一个带有装饰的版本。标记,通过一些技巧,我们可以根据箭头的长度绘制多次重复,然后我们可以绘制最后的标记,末端几乎是直的。
结果:

梅威瑟:
\documentclass[tikz,border=20pt]{standalone}
\usetikzlibrary{decorations.markings,arrows.meta,calc}

\begin{document}
    \begin{tikzpicture}[
        font=\tiny\sf,
        Nwaves/.store in=\Nwaves,Nwaves=7, %Environment variable for number of waves
        W/.store in=\W,W=0.4, % Variable for amplitude.
        Yscale/.store in=\Yscale,Yscale=1, % Only 1 or -1
        SineArrow/.style={%Decoration definition for SineArrow
            decorate,
            decoration={
                markings,
                mark= between positions 0 and 0.99-1/\Nwaves step 1/\Nwaves %Repeat marking n-1 times
                with {
                    \begin{scope}[yscale=\Yscale]
                        \pgfmathparse{\pgfdecoratedpathlength*0.0088/\Nwaves} %0,0088 obtained by tunning
                        \edef\H{\pgfmathresult}
                        \draw[#1,shorten >=0]
                        (0,0)
                            sin (\H,\W/2)
                            cos ++(\H,-\W/2)
                            sin ++(\H,-\W/2)
                            cos ++(\H,\W/2);
                    \end{scope}
                },
                mark= at position 1 % Draw the last marking
                with {
                    \begin{scope}[yscale=\Yscale]
                        \pgfmathparse{\pgfdecoratedpathlength*0.0088/\Nwaves}
                        \edef\H{\pgfmathresult}
                        \draw[#1,->]
                        (-4*\H,0)
                            to [in=180,out={atan(\H/-\W)+90}, looseness=1.5](0,0);% 103 an ofset for arrow orientation.
                    \end{scope}
                }
            }
        },
        solid node/.style={circle,draw,inner sep=1.2,fill=black},
        >={Latex}
    ]

    % Start drawing the thing.
    % Nodes
    \node (1) [solid node,label=left:{$1$}] at (0,3){};
    \node (i) [solid node,label=80:$i$] at (3,3){};
    \node (j) [solid node,label=left:{$j$}] at (2,0.3){};
    \node (n) [solid node,label=right:{$n$}] at (5,0){};

    % Arrows
    \draw[%Wave Green
        SineArrow=cyan!30!green,
        Nwaves=4,
        W=0.7,
        shorten >= 1pt
    ](1)
        -- (i.center)
        node[midway, below=3mm]{c};

    \draw[blue]
        (j)%Second wave displacement
            to[out=-90+5, in=-180-60] ++(0.1,-0.3)
            coordinate (temp);
    \draw[%second wade starting from teportal coordinate
        SineArrow=blue,
        Nwaves=3,
        shorten >= 1pt,
        Yscale=-1,
        W=0.2
    ](temp)
        -- (n.center)
        node[midway, below=1mm]{c};

    %Complementary arrows.
    \draw[dashed,->](i) to[out=-90+15, in=90-15*3] (j);
    \draw[dashed,->](j) to[out=90+15, in=-90-15*3] (i);
    \draw[->](i)
        to[out=35, in=35, looseness=2] ++(1,-1.5) node[below right]{b}
        to[out=35-180, in=-15](j) ;
    \end{tikzpicture}
\end{document}
答案3
并没有真正回答如何正确地将箭头附加到装饰路径上的问题,而且可能不是解决这个问题最直接的方法,但你可以利用并使用和运算符\pic绘制路径:sincos
\documentclass[border=10pt]{standalone}
\usepackage{tikz}
\usetikzlibrary{arrows.meta}

\tikzset{
    >={Latex},
    solid node/.style={
        circle,
        fill,
        inner sep=1.25pt,
    },
    pics/sine wave/.style={
        code={
            \tikzset{sine wave/.cd, #1}
            \coordinate[at={\pgfkeysvalueof{/tikz/sine wave/from}}] (-from);
            \coordinate[at={\pgfkeysvalueof{/tikz/sine wave/to}}] (-to);
            \path (-from); \pgfgetlastxy{\startx}{\starty}
            \path (-to); \pgfgetlastxy{\endx}{\endy}
            \pgfmathsetmacro{\currentpathlength}{sqrt((\endx-\startx)^2+(\endy-\starty)^2)}
            \pgfmathsetmacro{\currentpathrotate}{atan2((\endy-\starty),(\endx-\startx))}
            \pgfmathsetmacro{\segmentlength}{\currentpathlength/\pgfkeysvalueof{/tikz/sine wave/frequency}/4}
            \pgfmathsetmacro{\segmentheight}{\pgfkeysvalueof{/tikz/sine wave/amplitude}/2}
            \pgfmathsetmacro{\frequencyint}{int(\pgfkeysvalueof{/tikz/sine wave/frequency})}
            \pgfmathsetmacro{\isinteger}{\pgfkeysvalueof{/tikz/sine wave/frequency}==\frequencyint?1:0)}
            \draw[rotate={\currentpathrotate}, pic actions] (-from)
                \foreach \n in {1,...,\frequencyint} {
                    sin +({\segmentlength*1pt},{\segmentheight})
                    cos +({\segmentlength*1pt},{-1*\segmentheight})
                    sin +({\segmentlength*1pt},{-1*\segmentheight})
                    cos +({\segmentlength*1pt},{\segmentheight})
                }
                \ifnum\isinteger=1\else
                    sin +({\segmentlength*1pt},{\segmentheight})
                    cos +({\segmentlength*1pt},{-1*\segmentheight})
                \fi;
        }
    },
    sine wave/from/.initial={(0,0)},
    sine wave/to/.initial={(1,0)},
    sine wave/frequency/.initial={1},
    sine wave/amplitude/.initial={0.25}
}

\begin{document}
    \begin{tikzpicture}
        \node (1) [solid node,label=left:{$1$}] at (0,3){};
        \node (i) [solid node,label=above:{$i$}] at (3,3){};
        \node (j) [solid node,label=left:{$j$}] at (2,0.3){};
        \node (n) [solid node,label=right:{$n$}] at (5,0){};
        \draw[densely dashed, ->, bend left=20] (j) to (i);
        \draw[densely dashed, ->, bend left=20] (i) to (j);
        \path (1) -- (i) node[midway, below=5pt] {$c$};
        \pic[->] {sine wave={from={(1)}, to={(i)}, frequency={3.5}}};
        \path (j) -- (n) node[midway, below=5pt] {$c$};
        \pic[->] {sine wave={from={(j)}, to={(n)}, frequency={2.5}, amplitude={-0.33}}};
    \end{tikzpicture}
\end{document}

遗憾的是,这样箭头就不会真正结束于节点形状的边界。您需要手动调整它(因为我们知道圆圈的大小inner sep=1.25pt,我们可以shorten >=1.25pt在这里使用)。您还可以添加bending库来提供弯曲箭头的功能:
\documentclass[border=10pt]{standalone}
\usepackage{tikz}
\usetikzlibrary{arrows.meta, bending}

\tikzset{
    >={Latex[flex]},
    solid node/.style={
        circle,
        fill,
        inner sep=1.25pt,
    },
    pics/sine wave/.style={
        code={
            \tikzset{sine wave/.cd, #1}
            \coordinate[at={\pgfkeysvalueof{/tikz/sine wave/from}}] (-from);
            \coordinate[at={\pgfkeysvalueof{/tikz/sine wave/to}}] (-to);
            \path (-from); \pgfgetlastxy{\startx}{\starty}
            \path (-to); \pgfgetlastxy{\endx}{\endy}
            \pgfmathsetmacro{\currentpathlength}{sqrt((\endx-\startx)^2+(\endy-\starty)^2)}
            \pgfmathsetmacro{\currentpathrotate}{atan2((\endy-\starty),(\endx-\startx))}
            \pgfmathsetmacro{\segmentlength}{\currentpathlength/\pgfkeysvalueof{/tikz/sine wave/frequency}/4}
            \pgfmathsetmacro{\segmentheight}{\pgfkeysvalueof{/tikz/sine wave/amplitude}/2}
            \pgfmathsetmacro{\frequencyint}{int(\pgfkeysvalueof{/tikz/sine wave/frequency})}
            \pgfmathsetmacro{\isinteger}{\pgfkeysvalueof{/tikz/sine wave/frequency}==\frequencyint?1:0)}
            \draw[rotate={\currentpathrotate}, pic actions] (-from)
                \foreach \n in {1,...,\frequencyint} {
                    sin +({\segmentlength*1pt},{\segmentheight})
                    cos +({\segmentlength*1pt},{-1*\segmentheight})
                    sin +({\segmentlength*1pt},{-1*\segmentheight})
                    cos +({\segmentlength*1pt},{\segmentheight})
                }
                \ifnum\isinteger=1\else
                    sin +({\segmentlength*1pt},{\segmentheight})
                    cos +({\segmentlength*1pt},{-1*\segmentheight})
                \fi;
        }
    },
    sine wave/from/.initial={(0,0)},
    sine wave/to/.initial={(1,0)},
    sine wave/frequency/.initial={1},
    sine wave/amplitude/.initial={0.25}
}

\begin{document}
    \begin{tikzpicture}
        \node (1) [solid node,label=left:{$1$}] at (0,3){};
        \node (i) [solid node,label=above:{$i$}] at (3,3){};
        \node (j) [solid node,label=left:{$j$}] at (2,0.3){};
        \node (n) [solid node,label=right:{$n$}] at (5,0){};
        \draw[densely dashed, ->, bend left=20] (j) to (i);
        \draw[densely dashed, ->, bend left=20] (i) to (j);
        \path (1) -- (i) node[midway, below=5pt] {$c$};
        \pic[->, shorten >=1.25pt] {sine wave={from={(1)}, to={(i)}, frequency={3.5}}};
        \path (j) -- (n) node[midway, below=5pt] {$c$};
        \pic[->, shorten >=1.25pt] {sine wave={from={(j)}, to={(n)}, frequency={2.5}, amplitude={-0.33}}};
    \end{tikzpicture}
\end{document}
