

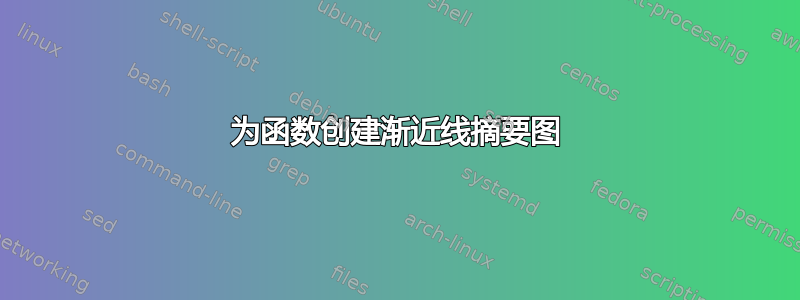
我希望该图类似于以下内容:

然而,我制作的图形与这个描述不符
 这是我的尝试
\documentclass[]{article}
\usepackage[left=.5cm,right=.5cm,top=3cm,bottom=1cm]{geometry}
\usepackage{tikz}
\usepackage{tkz-euclide}
\usepackage{amsmath}
\usepackage{amssymb}
\usepackage{amsfonts}
\usepackage{esvect}
\usepackage{ifthen}
\usepackage{stmaryrd}
\usepackage{xspace}
\usepackage{mathtools}

\newcommand{\lm}[2]{\displaystyle{\lim_{{#1}\to {#2}}}}

\begin{document}

\begin{center}
\begin{tikzpicture}
\node[rectangle, draw=brown, fill=brown!75, minimum height=1cm, minimum width=5cm, rounded corners] (1) {$\lm{x}{\infty}f(x) = a$};
\node[rectangle, draw=brown, fill=brown!75, minimum height=1cm, minimum width=5cm, rounded corners, right= 1cm of 1] (2) {$\lm{x}{\infty}f(x) = \infty$};
\node[rectangle, draw=brown, fill=brown!75, minimum height=1cm, minimum width=5cm, rounded corners, right= 1cm of 2] (3) {$\lm{x}{a}f(x) = a$};
\node[rectangle, draw=cyan, fill=cyan!50, minimum height=1cm, minimum width=5cm, rounded corners, below left= 1cm and 0cm of 2] (4) {$\lm{x}{\infty}\left[f(x) - (ax - b)\right] = 0$};
\node[rectangle, draw=cyan, fill=cyan!50, minimum height=1cm, minimum width=4cm, rounded corners, right= 1mm of 4] (5) {$\lm{x}{\infty}\dfrac{f(x)}{x} = a \ ; \ a \neq 0$};
\node[rectangle, draw=cyan, fill=cyan!50, minimum height=1cm, minimum width=3cm, rounded corners, right= 1mm of 5] (6) {$\lm{x}{\infty}\dfrac{f(x)}{x} = \infty$};
\node[rectangle, draw=cyan, fill=cyan!50, minimum height=1cm, minimum width=3cm, rounded corners, right= 1mm of 6] (7) {$\lm{x}{\infty}\dfrac{f(x)}{x} = 0$};
\node[rectangle, draw=cyan, fill=cyan!50, minimum height=1cm, minimum width=3cm, rounded corners, below left= 1cm and -2cm of 5] (8) {$\lm{x}{\infty}\left[f(x) - ax\right] = b$};
\node[rectangle, draw=cyan, fill=cyan!50, minimum height=1cm, minimum width=3cm, rounded corners, right= 1mm of 8] (9) {$\lm{x}{\infty}\left[f(x) - ax\right] = \infty$};
\node[rectangle, draw=green, fill=green!50, minimum height=5cm, rounded corners, below left = 1cm and 2cm of 8] (10) {
\begin{minipage}{2.5cm}
$(C_f)$ admet une \\ asymptote horizontale \\ d'équation $y=a$ \\ au voisinage de $\infty$
\end{minipage}};
\node[rectangle, draw=green, fill=green!50, minimum height=5cm, rounded corners, right = 1mm of 10] (11) {
\begin{minipage}{2.5cm}
$(C_f)$ admet une \\ asymptote oblique \\ d'équation $y=ax+b$ \\ au voisinage de $\infty$
\end{minipage}};
\node[rectangle, draw=green, fill=green!50, minimum height=5cm, rounded corners, right = 1mm of 11] (12) {
\begin{minipage}{2.5cm}
$(C_f)$ admet une \\ branche parabolique \\ de direction la droite \\ d'équation $y=ax$ \\ au voisinage de $\infty$
\end{minipage}};
\node[rectangle, draw=green, fill=green!50, minimum height=5cm, rounded corners, right = 1mm of 12] (13) {
\begin{minipage}{2.5cm}
$(C_f)$ admet une \\ branche parabolique \\ de direction l'axe des ordonnées \\ d'équation $y=ax$ \\ au voisinage de $\infty$
\end{minipage}};
\node[rectangle, draw=green, fill=green!50, minimum height=5cm, rounded corners, right = 1mm of 13] (14) {
\begin{minipage}{2.5cm}
$(C_f)$ admet une \\ branche parabolique \\ de direction l'axe des abscisses \\ d'équation $y=ax$ \\ au voisinage de $\infty$
\end{minipage}};
\node[rectangle, draw=green, fill=green!50, minimum height=5cm, rounded corners, right = 1mm of 14] (15) {
\begin{minipage}{2.5cm}
$(C_f)$ admet une \\ asymptote verticale \\ d'équation $x=a$
\end{minipage}};
\draw[blue, very thick,-latex] ([xshift=-2cm]1.south) -- ([xshift=-1cm] 10.north);
\draw[blue, very thick,-latex] ([xshift=2cm]3.south) -- ([xshift=1cm] 15.north);
\draw[blue, very thick,-latex] ([xshift=-1mm]2.south) -- (4.north);
\draw[blue, very thick,-latex] (2.south) -- (5.north);
\draw[blue, very thick,-latex] ([xshift=1mm]2.south) -- (6.north);
\draw[blue, very thick,-latex] ([xshift=3mm]2.south) -- (7.north);
\draw[blue, very thick,-latex] (5.south) -- (8.north);
\draw[blue, very thick,-latex] (5.south) -- (9.north);
\draw[blue, very thick,-latex] (4.south) -- (11.north);
\draw[blue, very thick,-latex] (8.south) -- (11.north);
\draw[blue, very thick,-latex] (9.south) -- (12.north);
\draw[blue, very thick,-latex] (6.south) -- (13.north);
\draw[blue, very thick,-latex] (7.south) -- (14.north);
\end{tikzpicture}
\end{center}

\end{document}
答案1
这是实现此目的的一种方法,尽可能重复使用您的方法。但是,对于布局,有更好、更一致的替代方案。至少这是一个更好的起点。
请关注flow of changes我的评论:
% ~~~ REFACTORING ~~~~~~~~~~~~
% * commented out unsused packages
% * defining styles to simplify code (you can still remove or vary all those \\)
% * adjusted code indenting and formatting for better visibility of what's going on
% * tried \def vs. \newcommand, which seems to be a bit faster during compile
%   (Tikz seems to prefer TeX-notation here)
% * demonstrated refactoring for the connectors: (2) -- (4), (5) -- (8)
The styles与颜色、尺寸等相关的功能可以进一步重构,但目前已经足够好了。移位功能也一样。
Please look up所有这些细节都并行在手册。
For the brown row我采用了您的方法,简化了转变,即替换了您的选择权(如上所述,这导致了错误)。
For the other ones方法有所不同:
- 将第一个(最左边)放置
\node在绝对位置 - 将它们从东到西放置,并在其间设置一些 xshift,定义在
XSBL等中。
The text in the green boxes可以通过text width=和在 Tikz 中更好地控制align=,请参阅手册。\\在我的方法中它们不再是必要的,但是您仍然可以使用它们来更好地控制文本流。
The changes for the connectors我针对线条(2) -- (4)和进行了演示(5) -- (8),并将详细的调整留给您:
- 第一个很简单,
- 第二个需要一个中间点,以相对坐标给出
- ! 向下移动和角半径可能会导致伪影!
The key syntax here使用极坐标<node name>.<angle>。例如,(2.185)取节点 (2),从该节点中心和角度(或按航海术语比西稍远一点)辐射光束185deg,直到它与节点边界相交。这样,您可以按您想要的方式移动起点和终点。
Lots is left for you在调整方面,基本上是:
- 的变化
XSB,XSBL以及XSG - 每个节点的极角
- 也许左边节点的绝对位置
Putting an arrow midway是可能的,但需要一些修饰,这在大多数情况下会增加编译时间。你真的需要它吗?
Finally从一开始就进行干净的编码并尽可能多地重构始终是一个好主意。

% ~~~ REFACTORING ~~~~~~~~~~~~
% * commented out unsused packages
% * defining styles to simplify code (you can still remove or vary all those \\)
% * adjusted code indenting and formatting for better visibility of what's going on
% * tried \def vs. \newcommand, which seems to be a bit faster during compile
%   (Tikz seems to prefer TeX-notation here)
% * demonstrated refactoring for the connectors: (2) -- (4), (5) -- (8)

\documentclass[]{article}
\usepackage[left=.5cm,right=.5cm,top=3cm,bottom=1cm]{geometry}
\usepackage{tikz}
\usetikzlibrary{arrows.meta}    % <<<
%\usepackage{tkz-euclide}
\usepackage{amsmath}
\usepackage{amssymb}
\usepackage{amsfonts}
%\usepackage{esvect}
%\usepackage{ifthen}
%\usepackage{stmaryrd}
%\usepackage{xspace}
%\usepackage{mathtools}

%\newcommand{\lm}[2]{\displaystyle{\lim_{{#1}\to {#2}}}}
\def\lm#1#2{\displaystyle{\lim_{{#1}\to {#2}}}}

\begin{document}

\begin{center}
 \begin{tikzpicture}[
    DIM/.style={ minimum height=1cm, minimum width=5cm, rounded corners},
    A/.style={draw=brown, fill=brown!75,DIM},
    B/.style={draw=cyan,  fill=cyan!50, DIM,minimum width=3cm},
    C/.style={draw=green, fill=green!50, minimum height=5cm,
              rounded corners,align=center,text width=25mm},
    XSB/.style ={xshift=73mm},
    XSBL/.style={anchor=west,xshift=2mm},
    XSG/.style ={anchor=west,xshift=4mm},
    ARR/.style ={blue, very thick,->,rounded corners=16pt},
    > = {Stealth},
 ]
    % ~~~ brown row ~~~~~~~~~~~~~~~~~~~~~~~~~~~~~~~~~~~~
    \node[A,anchor=west] (1) at (0,0)         {$\lm{x}{\infty}f(x) = a$};
    \node[A] (2)             at ([XSB] 1)     {$\lm{x}{\infty}f(x) = \infty$};
    \node[A] (3)             at ([XSB] 2)     {$\lm{x}{a}f(x) = a$};

    % ~~~ 1st blue row ~~~~~~~~~~~~~~~~~~~~~~~~~
    \node[B,anchor=west]      (4) at (2,-3)   {$\lm{x}{\infty}\left[f(x) - (ax - b)\right] = 0$};
    \node[B,XSBL] (5) at (4.east) {$\lm{x}{\infty}\dfrac{f(x)}{x} = a \ ; \ a \neq 0$};
    \node[B,XSBL] (6) at (5.east) {$\lm{x}{\infty}\dfrac{f(x)}{x} = \infty$};
    \node[B,XSBL] (7) at (6.east) {$\lm{x}{\infty}\dfrac{f(x)}{x} = 0$};

    % ~~~ 2nd blue row ~~~~~~~~~~~~~
    \node[B,anchor=west]      (8) at (4,-6)   {$\lm{x}{\infty}\left[f(x) - ax\right] = b$};
    \node[B,XSBL] (9) at (8.east) {$\lm{x}{\infty}\left[f(x) - ax\right] = \infty$};

    % ~~~ green row ~~~~~~~~~~~~~~~~~~~~~~~~~~~~~~
    \node[C,anchor=west] (10) at (0,-12){
                                $(C_f)$ admet une  asymptote horizontale
                                d'équation $y=a$ \\ au voisinage de $\infty$};
    \node[C,XSG] (11) at (10.east) {
                                $(C_f)$ admet une \\ asymptote oblique \\
                                d'équation $y=ax+b$ \\ au voisinage de $\infty$};
    \node[C,XSG] (12) at (11.east) {
                                $(C_f)$ admet une \\ branche parabolique \\
                                de direction la droite \\ d'équation $y=ax$ \\
                                au voisinage de $\infty$};
    \node[C,XSG] (13) at (12.east) {
                                $(C_f)$ admet une \\ branche parabolique \\
                                de direction l'axe des ordonnées \\ d'équation
                                $y=ax$ \\ au voisinage de $\infty$};
    \node[C,XSG] (14) at (13.east) {
                                $(C_f)$ admet une \\ branche parabolique \\
                                de direction l'axe des abscisses \\
                                d'équation $y=ax$ \\ au voisinage de $\infty$};
    \node[C,XSG] (15) at (14.east) {
                                $(C_f)$ admet une \\ asymptote verticale
                                \\ d'équation $x=a$};

%   % ~~~ connectors ~~~~~~~~~~~~~~~~
    \draw[ARR] ([xshift=-2cm]1.south) -- ([xshift=-1cm] 10.north);
    \draw[ARR] ([xshift=2cm]3.south) -- ([xshift=1cm] 15.north);

    % ~~~ TO DO: rework all other \draw's like this one: ~~~~~~~~~
    \draw[ARR] (2.185) -| (4.20);

    \draw[blue, very thick,-latex] (2.south) -- (5.north);
%   \draw[blue, very thick,-latex] ([xshift=1mm]2.south) -- (6.north);
%   \draw[blue, very thick,-latex] ([xshift=3mm]2.south) -- (7.north);

    \draw[ARR] (5.230) -- ++(0,-.6) -| (8.north);


%   \draw[blue, very thick,-latex] (5.south) -- (9.north);
%   \draw[blue, very thick,-latex] (4.south) -- (11.north);
%   \draw[blue, very thick,-latex] (8.south) -- (11.north);
%   \draw[blue, very thick,-latex] (9.south) -- (12.north);
%   \draw[blue, very thick,-latex] (6.south) -- (13.north);
%   \draw[blue, very thick,-latex] (7.south) -- (14.north);
 \end{tikzpicture}
\end{center}

\end{document}