

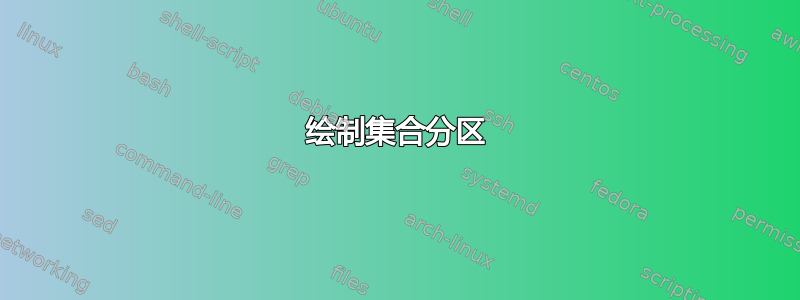
我想重现此图

我尝试过:
\documentclass{standalone}
\usepackage{tikz}

\begin{document}
\begin{tikzpicture}
    \draw (0,0) ellipse (3cm and 2cm);

    \foreach \i in {1,...,5}
        \draw (0,0) -- ({360/5*\i}:3cm);

    \foreach \i/\label in {1/A_1, 2/A_2, 3/A_3, 4/A_4, 5/A_5}
        \node at ({360/5*(\i-0.5)}:2.5cm) {\(\label\)};

    \node at (-2.5cm,2.5cm) {$\Omega$};
\end{tikzpicture}
\end{document}
结果

答案1
\documentclass[border=5mm]{standalone}
\usepackage{tikz}
\usetikzlibrary{intersections}
\begin{document}
\begin{tikzpicture}
\draw (0,0) ellipse[x radius=3cm, y radius=2cm];
\foreach \i in {1,...,5} \path ({360/5*\i}:3cm and 2cm) coordinate (A\i);
\path (-2.5,0) node {$\mathrm{A}_1$};
\path (130:0.6*3cm and 0.6*2cm) node {$\mathrm{A}_2$};
\path (280:0.1*3cm and 0.1*2cm) node {$\mathrm{A}_3$};
\path (30:0.7*3cm and 0.7*2cm) node {$\mathrm{A}_4$};
\path (-30:0.7*3cm and 0.7*2cm) node {$\mathrm{A}_5$};
\draw[name path=curve]
    (A4)
    .. controls +(110:0.5) and +(-5:0.5) ..
    (A1)
    .. controls +(175:0.5) and +(-60:0.5) ..
    (A3)
    .. controls +(120:0.5) and +(-30:1.5) ..
    (A2);
\path[name path=line] (0,0) -- (3,0);
\path[name intersections={of=curve and line, by=Z}];
\draw (Z) -- (3,0);
\path (160:3cm and 2cm) coordinate (A);
\path (A) ++(160:1cm) node[circle, draw] (omega) {$\Omega$};
\draw (omega) -- (A);
\end{tikzpicture}
\end{document}

答案2
只是为了好玩。这里有一种方法。
\documentclass[border=0.618cm]{standalone}
\usepackage{tikz}
\usetikzlibrary {shapes.geometric}

\begin{document}
\begin{tikzpicture}[line width=1.5pt]
%The empty ellipse node with minimum width 6cm and minimum height 4cm
\node [ellipse,draw,minimum width=6cm, minimum height=4cm] (ep) at (0,0) {};

%Draw the Bézier curve and the horizontal line to make segments inside the ellipse
\draw ([shift={(0.5\pgflinewidth,-0.5\pgflinewidth)}]ep.145)
.. controls ++(1.2,-1) and ++(-0.2,0.2)
.. ([shift={(0.5\pgflinewidth,0.5\pgflinewidth)}]ep.215)
.. controls ++(0.2,-0.2) and ++ (-0.3,0.2)
.. ([shift={(-0.5\pgflinewidth,-0.5\pgflinewidth)}]ep.60)
.. controls ++(0.3,-0.2) and ++(0,0)
.. node (mp) [pos=0.485] {}  ([yshift=0.5\pgflinewidth]ep.-65);
\draw (mp.center) -- ([xshift=-0.5\pgflinewidth]ep.east);

%Draw label omega outside the ellipse
\node (lb) [draw,circle] at ([shift={(-0.5,0.5)}]ep.155) {$\Omega$};
\draw (ep.155) -- (lb);

%Draw the labels for each segment
\node at ([xshift=0.75cm]ep.west) {$A_1$};
\node at ([shift={(-0.75cm,1cm)}]ep.center) {$A_2$};
\node at ([shift={(0.1cm,-0.7cm)}]ep.center) {$A_3$};
\node at ([shift={(1.95cm,0.75cm)}]ep.center) {$A_4$};
\node at ([shift={(1.95cm,-0.75cm)}]ep.center) {$A_5$};
\end{tikzpicture}
\end{document}

答案3
我尝试不使用贝塞尔曲线。此外,我还对椭圆的宽度和高度进行了一点自定义。也许这是一种幼稚的方法,但我想分享一种无需想象controls贝塞尔曲线选项的选项。
\documentclass[border=5mm]{standalone}
\usepackage{tikz}
\usetikzlibrary{calc}

\begin{document}
\begin{tikzpicture}[inner sep=0pt, outer sep=0pt,very thick]

    % ellipse centre and axis
    \coordinate (O) at (0,0);
    \def\A{3.5}
    \def\B{2}
    % circle centre
    \coordinate (C) at ($(O)+(145:{1.5*\A} and {1.5*\B})$);

    % ellipse
    \draw (O) ellipse ({\A} and {\B});

    % inside borders
    \foreach \n/\i in {1/130,2/232,3/70,4/285,5/355}
        \coordinate (A\n) at ($(O)+(\i:{\A} and {\B})$);

    \coordinate (A2I) at (229:{0.95*\A} and {0.95*\B});
    \coordinate (A2O) at (233:{0.95*\A} and {0.95*\B});
    \coordinate (A3I) at (74:{0.9*\A} and {0.9*\B});
    \coordinate (A3O) at (66:{0.9*\A} and {0.9*\B});

    \draw (A1)  to[out=320, in=65]
          (A2I) to[out=245, in=125]
          (A2)  to[out=-25, in=230]
          (A2O) to[out=50,  in=220]
          (A3I) to[out=40,  in=180]
          (A3)  to[out=320, in=90]
          (A3O) to[out=270, in=90] node[name=M,pos=0.45]{}
          (A4);
    \draw (M)--(A5);

    % circle
    \draw (C) circle (0.5);
    \coordinate (Om1) at ($(O)+(150:{\A} and {\B})$);
    \coordinate (Om2) at ($(C)+(150+180:0.5)$);
    \draw (Om1)--(Om2);

    % labels
    \node at (C){$\Omega$};
    \node at (180:{0.7*\A} and {0.7*\B}){$A_1$};
    \node at (125:{0.5*\A} and {0.5*\B}){$A_2$};
    \node at (280:{0.2*\A} and {0.2*\B}){$A_3$};
    \node at (35:{0.7*\A} and {0.7*\B}){$A_4$};
    \node at (320:{0.7*\A} and {0.7*\B}){$A_5$};

\end{tikzpicture}
\end{document}

答案4
使用decorations.markings库,我将节点放置在椭圆上,节点编号(mark-1)为(mark-5),然后添加节点(mi)。使用贝塞尔曲线,我描画曲线。使用barycentric coordinates,我放置标签A_1等。
\documentclass[border=5mm]{standalone}
\usepackage{tikz}
\usetikzlibrary {decorations.markings,calc,positioning}


\usepackage{alphalph}
\begin{document}
\tikzset{cmark/.style={decoration={
markings,mark=at position #1 with {\coordinate[name={mark-\pgfkeysvalueof{/pgf/decoration/mark info/sequence number}}];}},postaction={decorate}},
mimark/.style={decoration={
markings,mark=at position .5 with {\coordinate[name=mi];}},postaction={decorate}}
}


\begin{tikzpicture}
    \draw [cmark/.list={0,.2,.4,.45,.6,.8}](0,0) ellipse (3cm and 2cm);
\draw (mark-3)to[controls=+(-40:1.5) and +(120:.5)]
        (mark-5)to[controls=+(-30:.5) and +(170:1)]
        (mark-2);
\draw[mimark]   (mark-2)to [controls=+(-10:.5) and +(110:.5)](mark-6);
\draw(mark-1)--(mi);
\node at (barycentric cs:mark-3=1,mark-5=1) {$A_1$};
\node at (barycentric cs:mark-3=1,mark-5=1 ,mark-2=1) {$A_2$};
\node at (barycentric cs:mark-6=1,mark-5=1 ,mark-2=1) {$A_3$};
\node at (barycentric cs:mi=1,mark-1=1 ,mark-2=1) {$A_4$};
\node at (barycentric cs:mi=1,mark-1=1 ,mark-6=1) {$A_5$};
\node[above left=2mm and 4mm of mark-4,draw,circle,inner sep=1pt]{$\Omega$} edge (mark-4);
\end{tikzpicture}
\end{document}
