

\documentclass{article}

\usepackage{amsmath,amssymb,amsthm}
\usepackage{tikz}
\usepackage{pgfplots}
\pgfplotsset{compat=1.15}
\usepackage{mathrsfs}
\usepackage{amsmath,amssymb,amsthm}
\usepackage{geometry}
%%%%%%%%%%%%%%%%%%%
\usetikzlibrary{arrows}
\usepgfplotslibrary{fillbetween}
\usetikzlibrary{patterns,shapes.geometric}

\begin{document}

\begin{tikzpicture}
\draw[line width=.8pt,->] (-2,0.) -- node[pos=1,right]{}(2,0);
\draw[line width=.8pt,->] (0.,-2) -- node[pos=0.75,above right]{1}(0,2);
\draw[pattern=north west lines] (-1,1)--(1,1)--(1,-1)--(-1,-1)--(-1,1);
\node at (0,-2.25){$D$};
\end{tikzpicture}
 \begin{tikzpicture}
\draw[line width=.8pt,->] (-2,0.) -- node[pos=0.75,above right]{}(2,0);
\draw[line width=.8pt,->] (0.,-2) -- node[pos=0.75,above right]{1}(0,2);
\draw[pattern=north west lines] (0,0) circle (1 cm);
\node at (0,-2.5){$C$};
\end{tikzpicture}


\end{document}
答案1
好吧,为了直观地展示两幅图像之间的差异,我\fbox在您的图片中添加了以下内容,以便将它们打印在框架中:
\documentclass{article}

\usepackage{amsmath,amssymb,amsthm}
\usepackage{tikz}
\usepackage{pgfplots}
\pgfplotsset{compat=1.15}

\usepackage{mathrsfs}
\usepackage{geometry}

%%%%%%%%%%%%%%%%%%%
\usetikzlibrary{arrows}
\usepgfplotslibrary{fillbetween}
\usetikzlibrary{patterns,shapes.geometric}


\begin{document}

\fbox{
\begin{tikzpicture}
\draw[line width=.8pt,->] (-2,0.) -- node[pos=1,right]{}(2,0);
\draw[line width=.8pt,->] (0.,-2) -- node[pos=0.75,above right]{1}(0,2);
\draw[pattern=north west lines] (-1,1)--(1,1)--(1,-1)--(-1,-1)--(-1,1);
\node at (0,-2.25){$D$};
\end{tikzpicture}
}
\fbox{
\begin{tikzpicture} % <=================================================
\draw[line width=.8pt,->] (-2,0.) -- node[pos=0.75,above right]{}(2,0);
\draw[line width=.8pt,->] (0.,-2) -- node[pos=0.75,above right]{1}(0,2);
\draw[pattern=north west lines] (0,0) circle (1 cm);
\node at (0,-2.5){$C$};
\end{tikzpicture}
}
\end{document}
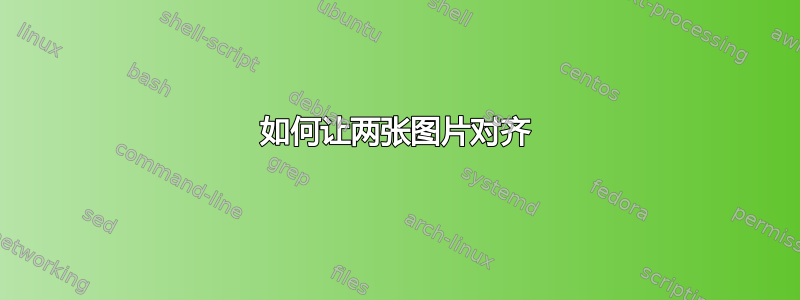
结果如下:

如您所见(屏幕截图中的红色箭头),两个图像的高度不同。现在让我们看看您的代码:
第一张图片:
\node at (0,-2.25){$D$};
第二张图片:
\node at (0,-2.5){$C$};
如果您选择相同的值,例如-2.5对于两个图像,图片都会对齐...
查看改变后的 MWE 值-2.5:
\documentclass{article}

\usepackage{amsmath,amssymb,amsthm}
\usepackage{tikz}
\usepackage{pgfplots}
\pgfplotsset{compat=1.15}

\usepackage{mathrsfs}
\usepackage{geometry}

%%%%%%%%%%%%%%%%%%%
\usetikzlibrary{arrows}
\usepgfplotslibrary{fillbetween}
\usetikzlibrary{patterns,shapes.geometric}


\begin{document}

\fbox{
\begin{tikzpicture}
\draw[line width=.8pt,->] (-2,0.) -- node[pos=1,right]{}(2,0);
\draw[line width=.8pt,->] (0.,-2) -- node[pos=0.75,above right]{1}(0,2);
\draw[pattern=north west lines] (-1,1)--(1,1)--(1,-1)--(-1,-1)--(-1,1);
\node at (0,-2.5){$D$};
\end{tikzpicture}
}
\fbox{
\begin{tikzpicture} % <=================================================
\draw[line width=.8pt,->] (-2,0.) -- node[pos=0.75,above right]{}(2,0);
\draw[line width=.8pt,->] (0.,-2) -- node[pos=0.75,above right]{1}(0,2);
\draw[pattern=north west lines] (0,0) circle (1 cm);
\node at (0,-2.5){$C$};
\end{tikzpicture}
}
\end{document}
结果如下:

并且不添加\fbox:
\documentclass{article}

\usepackage{amsmath,amssymb,amsthm}
\usepackage{tikz}
\usepackage{pgfplots}
\pgfplotsset{compat=1.15}

\usepackage{mathrsfs}
\usepackage{geometry}

%%%%%%%%%%%%%%%%%%%
\usetikzlibrary{arrows}
\usepgfplotslibrary{fillbetween}
\usetikzlibrary{patterns,shapes.geometric}


\begin{document}

\begin{tikzpicture}
\draw[line width=.8pt,->] (-2,0.) -- node[pos=1,right]{}(2,0);
\draw[line width=.8pt,->] (0.,-2) -- node[pos=0.75,above right]{1}(0,2);
\draw[pattern=north west lines] (-1,1)--(1,1)--(1,-1)--(-1,-1)--(-1,1);
\node at (0,-2.5){$D$};
\end{tikzpicture}
\begin{tikzpicture} % <=================================================
\draw[line width=.8pt,->] (-2,0.) -- node[pos=0.75,above right]{}(2,0);
\draw[line width=.8pt,->] (0.,-2) -- node[pos=0.75,above right]{1}(0,2);
\draw[pattern=north west lines] (0,0) circle (1 cm);
\node at (0,-2.5){$C$};
\end{tikzpicture}

\end{document}
结果如下:

答案2
作为托比约恩T他在评论中指出,将每个图形的基线放在原点就足够了[baseline={(0,0)}]。
正如@Mensch 所注意到的,更正了 C 和 D 标签的位置:

\documentclass{article}

\usepackage{amsmath,amssymb,amsthm}
\usepackage{tikz}
\usepackage{pgfplots}
\pgfplotsset{compat=1.15}
\usepackage{mathrsfs}
\usepackage{amsmath,amssymb,amsthm}
\usepackage{geometry}
%%%%%%%%%%%%%%%%%%%
\usetikzlibrary{arrows}
\usepgfplotslibrary{fillbetween}
\usetikzlibrary{patterns,shapes.geometric}

\begin{document}

\begin{tikzpicture}[baseline={(0,0)}]
\draw[line width=.8pt,->] (-2,0.) -- node[pos=1,right]{}(2,0);
\draw[line width=.8pt,->] (0.,-2)node[below]{$D$} -- node[pos=0.75,above right]{1}(0,2);
\draw[pattern=north west lines] (-1,1)--(1,1)--(1,-1)--(-1,-1)--(-1,1);
%\node at (0,-2.25){$D$};
\end{tikzpicture}
 \begin{tikzpicture}[baseline={(0,0)}]
\draw[line width=.8pt,->] (-2,0.) -- node[pos=0.75,above right]{}(2,0);
\draw[line width=.8pt,->] (0.,-2)node[below]{$C$} -- node[pos=0.75,above right]{1}(0,2);
\draw[pattern=north west lines] (0,0) circle (1 cm);
%\node at (0,-2.5){$C$};
\end{tikzpicture}
\end{document}
答案3
\node在以下 MWE 中,我将标记线中的 y 值从 更改为2.5。2.25通过此更改,两个图的 x 轴对齐,y 轴的标签也对齐。

\documentclass{article}

\usepackage{amsmath,amssymb,amsthm}
\usepackage{tikz}
\usepackage{pgfplots}
\pgfplotsset{compat=1.15}
\usepackage{mathrsfs}
\usepackage{amsmath,amssymb,amsthm}
\usepackage{geometry}
%%%%%%%%%%%%%%%%%%%
\usetikzlibrary{arrows}
\usepgfplotslibrary{fillbetween}
\usetikzlibrary{patterns,shapes.geometric}

\begin{document}

\begin{tikzpicture}
  \draw[line width=.8pt,->] (-2,0.) -- node[pos=1,right]{}(2,0);
  \draw[line width=.8pt,->] (0.,-2) -- node[pos=0.75,above right]{1}(0,2);
  \draw[pattern=north west lines] (-1,1)--(1,1)--(1,-1)--(-1,-1)--(-1,1);
  \node at (0,-2.25){$D$};
\end{tikzpicture}
\begin{tikzpicture}
  \draw[line width=.8pt,->] (-2,0.) -- node[pos=0.75,above right]{}(2,0);
  \draw[line width=.8pt,->] (0.,-2) -- node[pos=0.75,above right]{1}(0,2);
  \draw[pattern=north west lines] (0,0) circle (1 cm);
  \node at (0,-2.25){$C$}; %<-----
\end{tikzpicture}

\end{document}