

我希望能够指定一个函数,然后仅使用 来绘制该函数的图形pgfplot,或者使用它gnuplot来计算坐标。据我所知,函数的解析方式有两个主要区别:
pgf使用^和gnuplot用于**指数运算。这可以通过 轻松修复translate gnuplot=true,因此不是问题。另一个是
pgf三角函数使用度数,而gnuplot弧度则使用度数。有没有办法调整这个?
但是,忽略上面 #2 的可能问题,有没有办法指定一次函数,并pgfplots在有或没有的情况下使用它来绘制图形gnuplot?到目前为止,我一直pgfplots按如下方式指定函数:
\pgfmathdeclarefunction{FunctionF}{1}{\pgfmathparse{(#1)^(3)}}%
但是,当我想这样做时,gnuplot我一直将其定义如下:
\newcommand*{\FunctionFGnuplot}{(x)^3}%
有没有办法可以指定一次函数并在两种情况下使用它?需要说明的是,我对两者之间命令格式的不同没有异议addplot,只是对函数的规范不同。
下面是一个 MWE 来说明这一点:
\documentclass[border=5pt]{standalone}
\usepackage{pgfplots}

\newcommand*{\XAxisMin}{-1.0}
\newcommand*{\XAxisMax}{3.0}
\newcommand*{\YAxisMin}{-2.0}
\newcommand*{\YAxisMax}{10}

\newcommand*{\DomainMinF}{\XAxisMin}
\newcommand*{\DomainMaxF}{2.2}

\pgfkeys{/pgfplots/Axis Style/.style={
    clip=false,% so that we can see labels placed outside
    xmin=\XAxisMin, xmax=\XAxisMax,
    ymin=\YAxisMin, ymax=\YAxisMax,
    domain=\DomainMinF:\DomainMaxF,
    width=6.5cm
}}

% Gnuplot options here  have no effect if not using GnuPlot
\pgfkeys{/pgfplots/Plot Style/.style={
    translate gnuplot=true,% can use ‘^’ instead of ‘**’
    id=foo,
    mark=none,%
    domain=\DomainMinF:\DomainMaxF,%
    samples=50,%
    ultra thick,
}}

\newcommand*{\AddLabel}[1]{\node [align = center] at (axis cs: 0.4,5) {#1};}%
%-----------------------------

% I would like to only have to specify the function here once
\pgfmathdeclarefunction{FunctionF}{1}{\pgfmathparse{(#1)^(3)}}%
\newcommand*{\FunctionFGnuplot}{(x)^3}%


\begin{document}
\begin{tikzpicture}
\begin{axis}[Axis Style]
    \addplot [Plot Style, blue]
        ({x},{FunctionF(x)});%
    \AddLabel{1. without \\ Gnuplot}
\end{axis}
\end{tikzpicture}
\begin{tikzpicture}
\begin{axis}[Axis Style]
    \addplot [Plot Style, red]
        gnuplot% Use Gnuplot for Graph 2
        {\FunctionFGnuplot};%
    \AddLabel{2. with \\ Gnuplot}
\end{axis}
\end{tikzpicture}
\end{document}
答案1
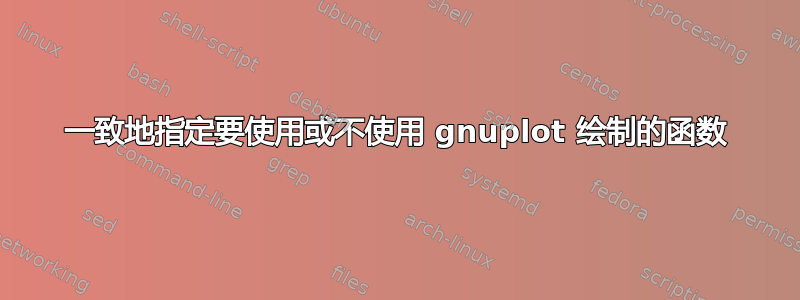
问题 2 的答案:您可以通过set angles degrees;在 gnuplot 代码中发出来告诉 gnuplot 使用度而不是弧度。
您可以定义一种新样式,将该行添加到 PGFplots 生成的 gnuplot 代码中:

\documentclass[border=5pt]{standalone}
\usepackage{pgfplots}

\makeatletter
\pgfplotsset{
     use degrees in gnuplot/.code={
        \xdef\pgfplots@gnuplot@format{\pgfplots@gnuplot@format set angles degrees;}
    }
}
\makeatother

\begin{document}
\begin{tikzpicture}
\begin{axis}[domain=0:360, samples=50, enlarge x limits=false, clip=false]
\addplot [red!50, line width=0.25cm]
    {sin(x)}
    node [anchor=north west] {PGFplots};
\addplot [gray]
    gnuplot {sin(x)}
    node [anchor=west] {Standard Gnuplot};
\addplot [use degrees in gnuplot,black, ultra thick]
    gnuplot {sin(x)}
    node [anchor=south west] {Gnuplot with degrees};
\end{axis}
\end{tikzpicture}
\end{document}