

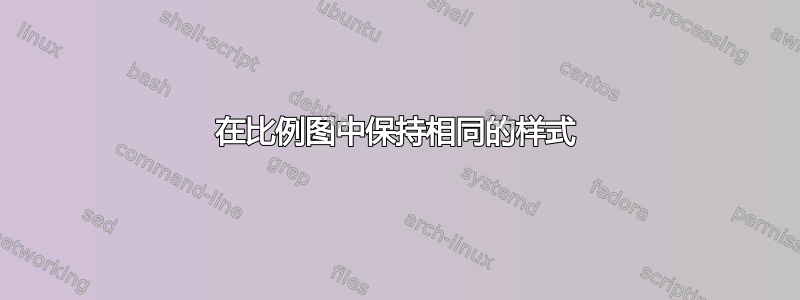
我有一张包含三条不同曲线的图表,其中两条与另一条相比非常小。因此,我决定在图表中添加此类曲线的放大图,方法如下:
\documentclass{scrbook}
\usepackage{classicthesis}
\usepackage{tikz}
\usepackage{pgfplots}
\begin{document}

\begin{tikzpicture}
    \begin{semilogxaxis}[
     xlabel={x},
     ylabel={y},
     xmin=1000, xmax=800000,
     ymin=0, ymax=25,
     enlargelimits,
     width=.8\columnwidth,
     every axis legend/.append style={nodes={right}},
     cycle list name=black white]
     \addplot
     coordinates{
     (1846,     0.15)
     (2304,     0.9)
     (2846,     1.5)
     };
     \addplot
     coordinates{
     (1846,     0.3)
     (2304,     0.9)
     (2846,     1.5)
     };
     \addplot
     coordinates{
     (632,      19)
     (916,      22)
     (1764,     15)
     (5106,     5)
     (8146,     4)
     (66026,    3)
     (407900,   2.5)
     (802932,   2)
     };
     \draw[black,dashed,thick] (axis cs:1500,-0.8) rectangle (axis cs:3500,2.2);
     \coordinate (pt) at (axis cs:150000,11);
     \legend{{Small curve \#1},{Small curve \#2},{Big curve}}
     \end{semilogxaxis}
\node at (pt) {
    \begin{tikzpicture}[baseline,trim axis left,trim axis right]
    \begin{semilogxaxis}[
     tiny,
     xmin=1700, xmax=3000,
     ymin=0, ymax=1.7,
     enlargelimits,
%    cycle list name=black white,
     /pgfplots/log ticks with fixed point,
     /pgfplots/xtick={1700,2200,2700}]
     \addplot[every mark/.append style={fill=gray},mark=*]
     coordinates{
     (1846,     0.15)
     (2304,     0.9)
     (2846,     1.5)
     };
     \addplot[every mark/.append style={fill=gray},mark=square]
     coordinates{
     (1846,     0.3)
     (2304,     0.9)
     (2846,     1.5)
     };
    \end{semilogxaxis}
    \end{tikzpicture}};
\end{tikzpicture}

\end{document}
我的问题是:放大的图表中是否可以保留相同的格式?我尝试手动指定它,但它不尊重填充。指定cycle list name也不起作用。
此外,但这不是强制性的,我希望有一个解决方案,避免指定放大图内的坐标。
答案1
tiny(和)样式footnotesize会破坏绘图选项,因为它们会调用every mark/.append style={size=<value>}。如果您使用small(不使用every mark) 并手动将宽度设置为合适的值,它就可以正常工作。
我建议设置axis line style=dashed插图图,以便更容易地将插图连接到图中的原始区域。
为了避免重新输入坐标,您应该\pgfplotstableread{<your data>}{<\macroname}在第一次绘图之前创建一个表格。然后您就可以\addplot table {<\macroname}绘制数据了。
请注意,您不需要使用带有的节点来tikzpicture放置插图,您只需提供选项at=(<coordinate>), anchor=center来获得相同的位置。

\documentclass{article}
\usepackage{pgfplots}


\begin{document}

\begin{tikzpicture}
    \begin{semilogxaxis}[
     xlabel={x},
     ylabel={y},
     xmin=1000, xmax=800000,
     ymin=0, ymax=25,
     enlargelimits,
     width=.8\columnwidth,
     every axis legend/.append style={nodes={right}},
     cycle list name=black white]
     \addplot
     coordinates{
     (1846,     0.15)
     (2304,     0.9)
     (2846,     1.5)
     };
     \addplot
     coordinates{
     (1846,     0.3)
     (2304,     0.9)
     (2846,     1.5)
     };
     \addplot
     coordinates{
     (632,      19)
     (916,      22)
     (1764,     15)
     (5106,     5)
     (8146,     4)
     (66026,    3)
     (407900,   2.5)
     (802932,   2)
     };
     \draw[black,dashed,thick] (axis cs:1500,-0.8) rectangle (axis cs:3500,2.2);
     \coordinate (pt) at (axis cs:150000,11);
     \legend{{Small curve \#1},{Small curve \#2},{Big curve}}
     \end{semilogxaxis}
    \begin{semilogxaxis}[
     at=(pt),anchor=center,
     small, width=4.5cm,
     xmin=1700, xmax=3000,
     ymin=0, ymax=1.7,
     enlargelimits,axis line style={dashed},
     cycle list name=black white,
     /pgfplots/log ticks with fixed point,
     /pgfplots/xtick={1700,2200,2700}]
     \addplot
     coordinates{
     (1846,     0.15)
     (2304,     0.9)
     (2846,     1.5)
     };
     \addplot
     coordinates{
     (1846,     0.3)
     (2304,     0.9)
     (2846,     1.5)
     };
    \end{semilogxaxis}
\end{tikzpicture}

\end{document}
答案2
使用spy图书馆虽然不是理想的但绝对很有趣。
\documentclass{article}
\usepackage{tikz}
\usepackage{pgfplots}
\usetikzlibrary{spy}
\begin{document}

\begin{tikzpicture}[spy using overlays={magnification=4, size=3cm, connect spies}]
    \begin{semilogxaxis}[
     xlabel={x},
     ylabel={y},
     xmin=1000, xmax=800000,
     ymin=0, ymax=25,
     enlargelimits,
     width=.8\columnwidth,
     every axis legend/.append style={nodes={right}},
     cycle list name=black white]
     \addplot coordinates{(1846,     0.15) (2304,     0.9) (2846,     1.5)};
     \addplot coordinates{(1846,     0.3)  (2304,     0.9) (2846,     1.5)};
     \addplot coordinates{(632,19) (916,22) (1764,15) (5106,5) (8146,4) (66026,3) (407900,2.5) (802932,2)};
     \legend{{Small curve \#1},{Small curve \#2},{Big curve}}
     \coordinate (handle) at (axis cs:2304,0.9);
     \end{semilogxaxis}
\begin{semilogxaxis}[shift={(4cm,2cm)},scale=0.5,xmin=1700, xmax=3000,
     ymin=0, ymax=1.7,
     enlargelimits,]
    \coordinate (a) at (axis cs:2304,0.9);
\spy [white] on (handle) in node at (a);
\end{semilogxaxis}
\end{tikzpicture}
\end{document}

简而言之,您在大轴环境中定义一些坐标,然后在另一个轴环境中使用间谍。使用轴坐标系定位似乎有效。您可以使用spy using outlines等进一步改进。