

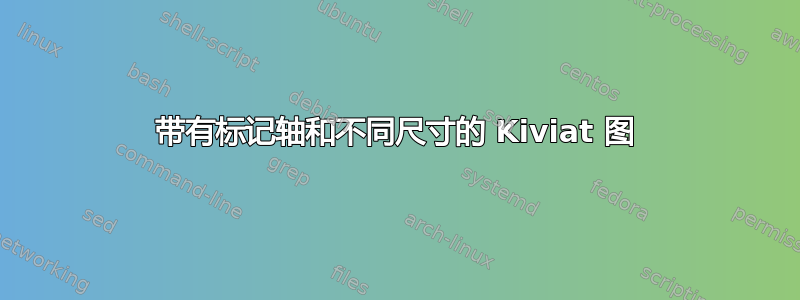
我正在尝试使用 tkz-kiviat 包来绘制 kiviat。以下示例生成以下图像:
\documentclass[]{scrartcl}
\usepackage[utf8]{inputenc}
\usepackage[T1]{fontenc}
\usepackage[upright]{fourier}
\usepackage[usenames,dvipsnames]{xcolor}
\usepackage{tkz-kiviat,numprint,fullpage}
\usetikzlibrary{arrows}
\thispagestyle{empty}

\begin{document}
\begin{tikzpicture}
\tkzKiviatDiagram[scale=1.25,label distance=.5cm,
        radial  = 5,
        gap     = 1,
        lattice = 5]{McCabe,LOC,Live Variables,Halstead N,Variablenspanne}
\tkzKiviatLine[thick,color=blue,mark=none,
               fill=blue!20,opacity=.5](3,3.5,3,3.5,3)
\tkzKiviatLine[thick,color=darkgray,
               fill=green!20,opacity=.5](0.5,1,0.5,0.75,1)
\tkzKiviatLine[ultra thick,mark=ball,
                 mark size=4pt,color =Maroon](2,3.75,1,1.5,2)
\tkzKiviatGrad[prefix=,unity=100,suffix=\ \texteuro](1)
\end{tikzpicture}

\end{document}

我的问题是:
- 是否可以有不同大小的轴?在前面的例子中,所有轴都从 0 到 5。我希望一个轴从 0 到 3,另一个轴从 0 到 2,依此类推。
- 是否可以用枚举值标记轴?在上例中,我不想使用 100 欧元、200 欧元等。我希望轴 1 为:主动、被动。轴 2 为:地球、金星、太阳……
这个包能实现吗?我需要使用另一个吗?
答案1
以下是我使用节点的替代方法的一个示例TikZ:
\documentclass[parskip]{scrartcl}
\usepackage[margin=15mm]{geometry}
\usepackage{tikz}
\usepackage{xifthen}
\usepackage{wasysym}

\newcommand{\myshape}{circle}
\newcommand{\myfillcolor}{white}
\newcommand{\mydrawcolor}{black}
\newcommand{\myfontcolor}{black}
\newcommand{\mynodecontent}{black}

\newcommand{\multiscale}[2]{% mode, planet
\ifthenelse{\equal{#1}{passive}}{\renewcommand{\mydrawcolor}{green!70!blue}}{}
\ifthenelse{\equal{#1}{active}}{\renewcommand{\mydrawcolor}{red!80!yellow}}{}
% ---------
\ifthenelse{\equal{#2}{Mercury}}{\renewcommand{\myfillcolor}{black!75}\renewcommand{\mynodecontent}{\mercury}}{}
\ifthenelse{\equal{#2}{Venus}}{\renewcommand{\myfillcolor}{black!50}\renewcommand{\mynodecontent}{\venus}}{}
\ifthenelse{\equal{#2}{Earth}}{\renewcommand{\myfillcolor}{black!25}\renewcommand{\mynodecontent}{\earth}}{}
\node[color=-\mydrawcolor,draw=\mydrawcolor,fill=\myfillcolor,circle,ultra thick,minimum size=1cm] {\textbf{\mynodecontent}};
}

\begin{document}

\begin{tikzpicture}
\multiscale{passive}{Mercury}
\end{tikzpicture}
\begin{tikzpicture}
\multiscale{passive}{Venus}
\end{tikzpicture}
\begin{tikzpicture}
\multiscale{passive}{Earth}
\end{tikzpicture}

\begin{tikzpicture}
\multiscale{active}{Mercury}
\end{tikzpicture}
\begin{tikzpicture}
\multiscale{active}{Venus}
\end{tikzpicture}
\begin{tikzpicture}
\multiscale{active}{Earth}
\end{tikzpicture}


\end{document}

在这种情况下,passive是绿色框架,active是红色框架,行星从太阳向外变成浅灰色。当然,你必须提供一个不错的解释。
编辑1:我看过了文档tkz-kiviat,据我所知,这是不可能的。我对它是如何实现的有了一点概念可能可以工作,但需要大量手动调整。另外,我对文本标签一无所知,因为pgfmath只能从类似数组的结构中提取数字。也许你也可以问阿尔特蒙杜斯,作者tkz-kiviat 也是该网站的用户。
\documentclass[parskip]{scrartcl}
\usepackage[margin=15mm]{geometry}
\usepackage{tikz}

\newcommand{\kivaxisnumbers}{3}
\newcommand{\kivcategorycounts}{{2,3,4}}
\newcommand{\kivkumulativecategorycounts}{{0,2,5}}
\newcommand{\kivcategorynames}{{1,2,10,20,30,100,200,300,400}}
\newcommand{\kivlcmcatcount}{12}

\newcommand{\kivlattice}{%
\pgfmathsetmacro{\kivaxisangle}{360/\kivaxisnumbers}
    \foreach \x in {1,...,\kivaxisnumbers}
    {   \foreach \y in {1,...,\kivlcmcatcount}
        {   \pgfmathsetmacro{\kivaxisstep}{6/\kivlcmcatcount}
            \draw[help lines] (\kivaxisangle*\x:\y*\kivaxisstep) -- (\kivaxisangle*\x+\kivaxisangle:\y*\kivaxisstep);
        }
    }
    \foreach \x in {1,...,\kivaxisnumbers}
    {   \draw[->] (0,0) -- (\kivaxisangle*\x:6cm);
        \pgfmathsetmacro{\kivaxissteps}{\kivcategorycounts[\x-1]}
        \pgfmathsetmacro{\kivaxisstep}{6/\kivcategorycounts[\x-1]}
        \foreach \y in {1,...,\kivaxissteps}
        {   \pgfmathsetmacro{\kivhelper}{\kivkumulativecategorycounts[\x-1]}
            \pgfmathtruncatemacro{\kivlabelname}{\kivcategorynames[\kivhelper+\y-1]}
            \node[circle,fill=black,label=\x*\kivaxisangle+90:\kivlabelname,inner sep=1pt] at (\kivaxisangle*\x:\kivaxisstep*\y) {};
        }
    }

}

\begin{document}

\begin{tikzpicture}
\kivlattice
\end{tikzpicture}

\end{document}

编辑2:添加一些数据(以轴的百分比表示):
\newcommand{\kivdatapoints}{}

\newcommand{\kivdata}[2]{% values in percentages of max, color
    \renewcommand{\kivdatapoints}{{#1}}
    \pgfmathsetmacro{\kivaxisangle}{360/\kivaxisnumbers}
    \pgfmathsetmacro{\kivcoordinate}{\kivdatapoints[0]*6}
    \fill[opacity=0.2,#2] (\kivaxisangle:\kivcoordinate)
        \foreach \x in {1,...,\kivaxisnumbers}
        {   %\pgfmathsetmacro{\kivcoordinate}{\kivdatapoints[\x-1]*6}
            -- (\kivaxisangle*\x:\kivdatapoints[\x-1]*6)
        }
    -- cycle;
}

\begin{document}

\begin{tikzpicture}
\kivlattice
\kivdata{0.2,0.9,0.6}{red}
\kivdata{0.7,0.1,0.8}{green}
\kivdata{0.4,0.35,0.3}{blue}
\end{tikzpicture}

编辑3:谢谢Brandon Kuczenski 的回答这个问题,我能够向轴添加文本标签:
\documentclass[parskip]{scrartcl}
\usepackage[margin=15mm]{geometry}
\usepackage{tikz}
\usepackage{arrayjobx}

\makeatletter
\usepackage{trimspaces}
\def\trimspace#1{\trim@spaces@in{#1}}
\makeatother

\newarray\kivaxisitemlabels
\readarray{kivaxisitemlabels}{%
Decision  & Yes    & No     &        &       &
Color     & Red    & Blue   & Yellow &       &
Direction & North  & East   & South  & West  &
Taste     & Sour   & Salty  & Bitter & Sweet &
World     & Normal & Nether & End    &       }
\dataheight=5

\newcommand{\kivcurrentlabel}[2]{\checkkivaxisitemlabels(#1,#2)\trimspace\cachedata \cachedata}

\newcommand{\kivaxisnumbers}{5}
\newcommand{\kivcategorycounts}{{2,3,4,4,3}}
\newcommand{\kivkumulativecategorycounts}{{0,2,5,9,13}}
%\newcommand{\kivcategorynames}{{1,2,10,20,30,100,200,300,400}}
\newcommand{\kivlcmcatcount}{12}

\newcommand{\kivlattice}{%
\pgfmathsetmacro{\kivaxisangle}{360/\kivaxisnumbers}
    \foreach \x in {1,...,\kivaxisnumbers}
    {   \foreach \y in {1,...,\kivlcmcatcount}
        {   \pgfmathsetmacro{\kivaxisstep}{6/\kivlcmcatcount}
            \draw[help lines] (\kivaxisangle*\x:\y*\kivaxisstep) -- (\kivaxisangle*\x+\kivaxisangle:\y*\kivaxisstep);
        }
    }
    \foreach \x in {1,...,\kivaxisnumbers}
    {   \draw[->] (0,0) -- (\kivaxisangle*\x:6cm);
        \pgfmathsetmacro{\kivaxissteps}{\kivcategorycounts[\x-1]}
        \pgfmathsetmacro{\kivaxisstep}{6/\kivcategorycounts[\x-1]}
        \foreach \y in {1,...,\kivaxissteps}
        {   %\pgfmathsetmacro{\kivhelper}{\kivkumulativecategorycounts[\x-1]}
            %\pgfmathtruncatemacro{\kivlabelname}{\kivcategorynames[\kivhelper+\y-1]}
            %\node[circle,fill=black,label=\x*\kivaxisangle+90:\kivlabelname,inner sep=1pt] at (\kivaxisangle*\x:\kivaxisstep*\y) {};
            \pgfmathtruncatemacro{\kivlabelnumber}{\y+1}
            \node[circle,fill=black,label=\x*\kivaxisangle+90:\kivcurrentlabel{\x}{\kivlabelnumber},inner sep=1pt] at (\kivaxisangle*\x:\kivaxisstep*\y) {};
        }
    }
}

\newcommand{\kivdatapoints}{}

\newcommand{\kivdata}[2]{% values in percentages of max, color
    \renewcommand{\kivdatapoints}{{#1}}
    \pgfmathsetmacro{\kivaxisangle}{360/\kivaxisnumbers}
    \pgfmathsetmacro{\kivcoordinate}{\kivdatapoints[0]*6}
    \fill[opacity=0.2,#2] (\kivaxisangle:\kivcoordinate)
        \foreach \x in {1,...,\kivaxisnumbers}
        {   %\pgfmathsetmacro{\kivcoordinate}{\kivdatapoints[\x-1]*6}
            -- (\kivaxisangle*\x:\kivdatapoints[\x-1]*6)
        }
    -- cycle;
}

\begin{document}

\begin{tikzpicture}
\kivlattice
\kivdata{0.2,0.9,0.6,0.5,0.5}{red}
\kivdata{0.7,0.1,0.8,0.6,.2}{green}
\kivdata{0.4,0.35,0.3,0.25,0.2}{blue}
\end{tikzpicture}

\end{document}

答案2
我创建了 tkz-kiviat 来仅绘制 kiviat 图。我不是 kiviat 图方面的专家,但就您而言,您没有得到符合您要求的 kiviat 图。
1)您需要使用定量从同一点开始的轴上表示的变量。
2) 辐条的数据长度与数据点的变量幅度相对于所有数据点中变量的最大幅度成比例。
对于实际的 tkz-kiviat,修改轴的唯一可能性是使用百分比,格子数为 10。这是比较值(为此使用 kiviat 图)和比较面积的更好方法。仅使用和授权数值。