


答案1
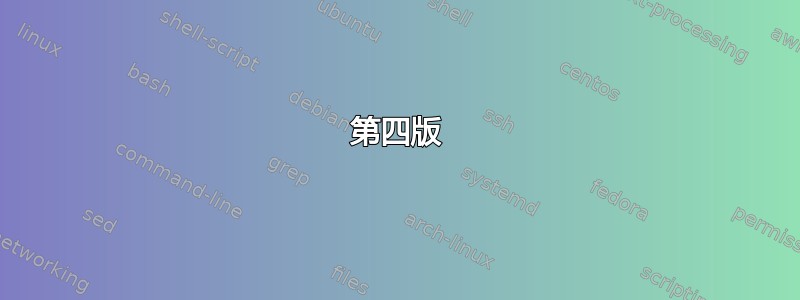
第四版
对第三版进行了一些修正:组标签的自动定位、弯曲箭头的正确长度、更好的刻度结尾(您注意到了吗666?;-))、样式分解(有两种全局样式: dartstyle和orig)。
以下是两个结果(使用dartstyle然后使用orig):


代码:
\documentclass{standalone}
\usepackage{tikz}
\usetikzlibrary{decorations.text}
\usepackage{ifthen}
\tikzset{
  orig/.style={
    hist 1/.style={fill=red!70!gray},
    hist 2/.style={fill=blue!60!white},
    hist 3/.style={fill=green!50!gray},
    arrow group/.style={draw,color=black,very thick,latex-latex},
    target/.style={fill=pink!60!black,draw=black,
      line width=1pt,double distance=1pt,double=white},
    rev text on arc/.style={
      decorate,decoration={text along path,
        text={##1},text align={align=center},
        text color=black,reverse path}
    },
    text on arc/.style={
      decorate,decoration={text along path,
        text={##1},text align={align=center},
        text color=black,
      },
    },
    major tick/.style={draw=white,thick},
    minor tick/.style={draw=white,thin,draw opacity=.5},
    tick label/.style={font=\tiny\bfseries},
    text=black,
    font=\bfseries\sffamily,
  },
  dartstyle/.style={
    hist 1/.style={fill=red!80!white},
    hist 2/.style={fill=yellow!60!white},
    hist 3/.style={fill=green!70!black},
    arrow group/.style={draw=white,white,very thick,latex-latex},
    target/.style={fill=black,draw=black,
      line width=1pt,double distance=1pt,double=white},
    rev text on arc/.style={
      decorate,decoration={text along path,
        text={##1},text align={align=center},
        text color=white,reverse path}
    },
    text on arc/.style={
      decorate,decoration={text along path,
        text={##1},text align={align=center},
        text color=white}
    },
    major tick/.style={draw=white,thick},
    minor tick/.style={draw=white,thin,draw opacity=.5},
    tick label/.style={font=\tiny\bfseries},
    text=white,
    font=\bfseries\sffamily,
  },
}

\def\astep{9} % step (degree) between sectors
\def\mstep{3} % half width (degree) of each sector
\def\min{8mm} % min distance from center
\def\max{4cm} % max distance from center

\def\mydata{%
  First Group/{%
    xxx/{10,30,60},%
    aab/{20,30,50},%
    aba/{30,30,40},%
    aad/{40,30,30},%
    aca/{50,30,20},%
    zcb/{60,10,30},%
    aaa/{10,30,60},%
    aab/{30,30,40},%
    aba/{10,80,10},%
    aad/{30,30,40},%
    aca/{10,30,60}%
  },%
  Second Group/{%
    yyy/{60,10,30},%
    zcb/{60,10,30},%
    aaa/{10,30,60},%
    aab/{30,30,40},%
    aba/{10,80,10},%
    aad/{30,30,40},%
    aca/{10,30,60},%
    zcb/{60,10,30},%
    zcb/{75,10,15},%
    aaa/{10,30,60}%
  },%
  Third Group/{%
    zzz/{30,30,40},%
    aba/{10,80,10},%
    aad/{30,30,40},%
    aca/{10,30,60},%
    zcb/{60,10,30},%
    zcb/{60,10,30},%
    aaa/{10,30,60},%
    aab/{30,30,40},%
    aba/{10,80,10},%
    aad/{30,30,40},%
    aca/{10,30,60},%
    zcb/{60,30,10}%
  }%
}

\begin{document}
\begin{tikzpicture}[orig]
  \tikzset{
    declare function={
      secttoangle(\sect)=(\sect)*\astep;
      percenttodist(\percent)=\min+(\max-\min)/100*\percent;
    },
  }

  \path[target]
  circle(\max+1.6cm);

  \def\cursectinit{-.666}
  \foreach \curgroup/\curdata in \mydata {
    \foreach \curlabel/\values [count=\cp] in \curdata {
      % angle for this current label
      \pgfmathsetmacro{\angle}{secttoangle(\cursectinit+\cp)}
      % percent
      \xdef\total{0}
      % histogram
      \foreach \val [count=\cv] in \values {
        \pgfmathsetmacro{\nexttotal}{\total+\val}
        \pgfmathsetmacro{\dmin}{percenttodist(\total)}
        \pgfmathsetmacro{\dmax}{percenttodist(\nexttotal)}
        % sector
        \path[hist \cv=\angle] (\angle+\mstep:\dmin pt)
        arc(\angle+\mstep:\angle-\mstep:\dmin pt) -- (\angle-\mstep:\dmax pt)
        arc(\angle-\mstep:\angle+\mstep:\dmax pt) -- cycle;
        % iteration
        \xdef\total{\nexttotal}
      }
      % label (with autorotation)
      \pgfmathtruncatemacro{\revlab}{and(\angle>90,\angle<270)?1:0}
      \ifthenelse{\equal{\revlab}{1}}{
        \node[rotate=180+\angle,anchor=east] at (\angle:\max) {\curlabel};
      }{
        \node[rotate=\angle,anchor=west] at (\angle:\max) {\curlabel};
      }
    }
    % group limits
    \pgfmathsetmacro{\newsectinit}{\cursectinit+\cp}
    \pgfmathsetmacro{\angleinit}{secttoangle(\cursectinit + 1)-\mstep}
    \pgfmathsetmacro{\anglefinal}{secttoangle(\newsectinit)+\mstep}
    % group label
    {
      \Large\bfseries\sffamily
      \pgfmathtruncatemacro{\anglem}{(\angleinit+\anglefinal)/2}
      \pgfmathtruncatemacro{\revtext}{and(\anglem>0,\anglem<180)?1:0}
      \ifthenelse{\equal{\revtext}{1}}{
        \draw[rev text on arc=\curgroup] (\angleinit:\max+1.1cm)
        arc(\angleinit:\anglefinal:\max+1.1cm);
      }{
        \draw[text on arc=\curgroup] (\angleinit:\max+1.1cm+.5em)
        arc(\angleinit:\anglefinal:\max+1.1cm+.5em);
      }
    }
    % group arrow
    \path[arrow group]
    (\angleinit:\max+9mm) arc(\angleinit:\anglefinal:\max+9mm);
    % iteration
    \pgfmathsetmacro{\newsectinit}{\newsectinit+1}
    \xdef\cursectinit{\newsectinit}
  }

  % level ticks
  \pgfmathsetmacro{\angleinit}{secttoangle(0)}
  \pgfmathsetmacro{\anglefinal}{secttoangle(\cursectinit-1)+\mstep}
  % major ticks with labels
  \foreach \percent in {0,50,100}{
    \pgfmathsetmacro{\dist}{percenttodist(\percent)}
    % tick
    \path[major tick] (\angleinit:\dist pt)
    arc(\angleinit:\anglefinal:\dist pt);
    % label
    \node[tick label,below,rotate=secttoangle(0)]
    at ({secttoangle(0)}:\dist pt) {\percent\%};
  }
  % minor ticks
  \foreach \percent in {10,20,30,40,60,70,80,90}{
    \pgfmathsetmacro{\dist}{percenttodist(\percent)}
    % tick
    \path[minor tick] (\angleinit:\dist pt)
    arc(\angleinit:\anglefinal:\dist pt);
  }

  % legend
  \foreach \mycat [count=\c] in {Bad,Mediocre,Good}{
    \path[hist \c=0] (2.75,-.5-.5*\c) rectangle ++(.2,.2) ++(0,-.1)
    node[right]{\mycat};
  }
\end{tikzpicture}
\end{document}
第三版
这是我的第三个版本:飞镖风格,更好的级别标记,图例......

\documentclass{standalone}
\usepackage{tikz}
\usetikzlibrary{decorations.text,shadows}
\usepackage{ifthen}
\tikzset{
  hist 1/.style={fill=red!80!white},
  hist 2/.style={fill=yellow!60!white},
  hist 3/.style={fill=green!70!black},
}

\def\astep{9} % step (degree) between sectors
\def\mstep{3} % half width (degree) of each sector
\def\min{8mm} % min distance from center
\def\max{4cm} % max distance from center

\def\mydata{%
  First Group/{%
    xxx/{10,30,60},%
    aab/{20,30,50},%
    aba/{30,30,40},%
    aad/{40,30,30},%
    aca/{50,30,20},%
    zcb/{60,10,30},%
    aaa/{10,30,60},%
    aab/{30,30,40},%
    aba/{10,80,10},%
    aad/{30,30,40},%
    aca/{10,30,60}%
  },%
  Second Group/{%
    yyy/{60,10,30},%
    zcb/{60,10,30},%
    aaa/{10,30,60},%
    aab/{30,30,40},%
    aba/{10,80,10},%
    aad/{30,30,40},%
    aca/{10,30,60},%
    zcb/{60,10,30},%
    zcb/{60,10,30},%
    aaa/{10,30,60}%
  },%
  Third Group/{%
    zzz/{30,30,40},%
    aba/{10,80,10},%
    aad/{30,30,40},%
    aca/{10,30,60},%
    zcb/{60,10,30},%
    zcb/{60,10,30},%
    aaa/{10,30,60},%
    aab/{30,30,40},%
    aba/{10,80,10},%
    aad/{30,30,40},%
    aca/{10,30,60},%
    zcb/{60,10,30}%
  }%
}

\begin{document}
\begin{tikzpicture}%
  [text=white,font=\bfseries\sffamily,
  declare function={
    secttoangle(\sect)=(\sect)*\astep;
    percenttodist(\percent)=\min+(\max-\min)/100*\percent;
  }]

  \path[fill=black] circle(\max+1.6cm);

  \def\cursectinit{0}
  \foreach \curgroup/\curdata in \mydata {
    \foreach \curlabel/\values [count=\cp] in \curdata {
      % angle for this current label
      \pgfmathsetmacro{\angle}{secttoangle(\cursectinit+\cp)}
      % percent
      \xdef\total{0}
      % histogram
      \foreach \val [count=\cv] in \values {
        \pgfmathsetmacro{\nexttotal}{\total+\val}
        \pgfmathsetmacro{\dmin}{percenttodist(\total)}
        \pgfmathsetmacro{\dmax}{percenttodist(\nexttotal)}
        % sector
        \path[hist \cv=\angle] (\angle+\mstep:\dmin pt)
        arc(\angle+\mstep:\angle-\mstep:\dmin pt) -- (\angle-\mstep:\dmax pt)
        arc(\angle-\mstep:\angle+\mstep:\dmax pt) -- cycle;
        % iteration
        \xdef\total{\nexttotal}
      }
      % label (with autorotation)
      \pgfmathtruncatemacro{\anglenode}{\angle}
      \ifthenelse{\( \anglenode > 90 \) \AND \( \anglenode < 270 \)}{
        \node[rotate=180+\anglenode,anchor=east] at (\angle:\max) {\curlabel};
      }{
        \node[rotate=\anglenode,anchor=west] at (\angle:\max) {\curlabel};
      }
      \typeout{label:\curlabel}
    }
    % group limits
    \pgfmathsetmacro{\newsectinit}{\cursectinit+\cp}
    \pgfmathsetmacro{\angleinit}{secttoangle(\cursectinit + 1)}
    \pgfmathsetmacro{\anglefinal}{secttoangle(\newsectinit)}
    \typeout{from:\angleinit,to:\anglefinal}
    % group label
    {
      \Large\bfseries\sffamily
      \draw[decorate,decoration={text along path,
        text=\curgroup,text align={align=center},
        text color=white,reverse path}]
      (\angleinit:\max+1.1cm) arc(\angleinit:\anglefinal:\max+1.1cm);
    }
    % group arrow
    \draw[white,very thick,latex-latex]
    (\angleinit:\max+9mm) arc(\angleinit:\anglefinal:\max+9mm);
    % iteration
    \pgfmathsetmacro{\newsectinit}{\newsectinit+1}
    \xdef\cursectinit{\newsectinit}
  }

  % levels
  \pgfmathsetmacro{\angleinit}{secttoangle(0)}
  \pgfmathsetmacro{\anglefinal}{secttoangle(\cursectinit-1)+\astep/2}
  % thick ticks with labels
  \foreach \percent in {0,50,100}{
    \pgfmathsetmacro{\dist}{percenttodist(\percent)}
    % tick
    \draw[white,thick] (\angleinit:\dist pt)
    arc(\angleinit:\anglefinal:\dist pt);
    % label
    \node[below,font=\tiny\bfseries,rotate=secttoangle(0)]
    at ({secttoangle(0)}:\dist pt) {\percent\%};
  }
  % thin ticks
  \foreach \percent in {10,20,30,40,60,70,80,90}{
    \pgfmathsetmacro{\dist}{percenttodist(\percent)}
    % tick
    \draw[white,draw opacity=.5] (\angleinit:\dist pt)
    arc(\angleinit:\anglefinal:\dist pt);
  }

  % legend
  \foreach \mycat [count=\c] in {Bad,Mediocre,Good}{
    \path[hist \c] (3,-.25+-.5*\c) rectangle ++(.2,.2) ++(0,-.1)
    node[right]{\mycat};
  }
\end{tikzpicture}
\end{document}
第二版
这是带有一些修饰的新版本:群组、阴影背景、级别……

\documentclass{standalone}
\usepackage{tikz}
\usetikzlibrary{decorations.text,shadows}
\usepackage{ifthen}
\tikzset{
  shaded/.style 2 args={
    draw=black,
    thin,rounded corners=1pt,
    top color=#1!50!black,
    bottom color=#1!30!black,
    middle color=#1,
    shading angle=#2-90,
  },
  hist 1/.style={shaded={cyan}{#1}},
  hist 2/.style={shaded={orange}{#1}},
  hist 3/.style={shaded={yellow}{#1}},
}

\def\astep{9} % width (degree) of each sector
\def\min{1cm} % min distance from center
\def\max{3cm} % max distance from center

\def\mydata{%
  First Group/{%
    xxx/{10,30,60},%
    aab/{20,30,50},%
    aba/{30,30,40},%
    aad/{40,30,30},%
    aca/{50,30,20},%
    zcb/{60,10,30},%
    aaa/{10,30,60},%
    aab/{30,30,40},%
    aba/{10,80,10},%
    aad/{30,30,40},%
    aca/{10,30,60}%
  },%
  Second Group/{%
    yyy/{60,10,30},%
    zcb/{60,10,30},%
    aaa/{10,30,60},%
    aab/{30,30,40},%
    aba/{10,80,10},%
    aad/{30,30,40},%
    aca/{10,30,60},%
    zcb/{60,10,30},%
    zcb/{60,10,30},%
    aaa/{10,30,60}%
  },%
  Third Group/{%
    zzz/{30,30,40},%
    aba/{10,80,10},%
    aad/{30,30,40},%
    aca/{10,30,60},%
    zcb/{60,10,30},%
    zcb/{60,10,30},%
    aaa/{10,30,60},%
    aab/{30,30,40},%
    aba/{10,80,10},%
    aad/{30,30,40},%
    aca/{10,30,60},%
    zcb/{60,10,30}%
  }%
}

\begin{document}
\begin{tikzpicture}[text=white,font=\bfseries,
  declare function={secttoangle(\sect)=(\sect)*\astep+\astep);},
  ]
  \sffamily
  \shade[top color=gray,bottom color=gray,middle color=black,shading angle=45]
  circle(\max+2cm);
  %\pgfmathsermacro{\angle}{-270}
  \def\cursectinit{0}
  \foreach \curgroup/\curdata in \mydata {
    \foreach \curlabel/\values [count=\cp] in \curdata {
      % angle for this current label
      \pgfmathsetmacro{\angle}{secttoangle(\cursectinit+\cp)}
      % distance from center
      \pgfmathsetmacro{\total}{\min}
      \pgfmathsetmacro{\am}{\max-\min}
      \xdef\total{\total}
      % histogram
      \foreach \val [count=\cv] in \values {
        \pgfmathsetmacro{\nexttotal}{\total pt+\am/100*\val}
        % sector
        \path[hist \cv=\angle]
        (\angle+\astep/2:\total pt)
        arc(\angle+\astep/2:\angle-\astep/2:\total pt)
        -- (\angle-\astep/2:\nexttotal pt)
        arc(\angle-\astep/2:\angle+\astep/2:\nexttotal pt)
        -- cycle;
        % iteration
        \xdef\total{\nexttotal}
      }
      % label (with autorotation)
      \pgfmathtruncatemacro{\anglenode}{\angle}
      \ifthenelse{\( \anglenode > 90 \) \AND \( \anglenode < 270 \)}{
        \node[rotate=180+\anglenode,anchor=east] at (\angle:\max) {\curlabel};
      }{
        \node[rotate=\anglenode,anchor=west] at (\angle:\max) {\curlabel};
      }
      \typeout{label:\curlabel}
    }
    \pgfmathsetmacro{\newsectinit}{\cursectinit+\cp}
    \pgfmathsetmacro{\angleinit}{secttoangle(\cursectinit + 1)}
    \pgfmathsetmacro{\anglefinal}{secttoangle(\newsectinit)}
    \typeout{from:\angleinit,to:\anglefinal}
    {
      \LARGE\bfseries
      \draw[decorate,
      font=\LARGE\bfseries,
      decoration={text along path,
        text=\curgroup,
        text align={align=center},
        text color=white,
        reverse path,
      }]
      (\angleinit:\max+1.2cm) arc(\angleinit:\anglefinal:\max+1.2cm);
    }

    \draw[white,very thick,latex-latex]
    (\angleinit:\max+1cm) arc(\angleinit:\anglefinal:\max+1cm);
    \pgfmathsetmacro{\newsectinit}{\newsectinit+1}
    \xdef\cursectinit{\newsectinit}
  }

  \pgfmathsetmacro{\angleinit}{secttoangle(0)}
  \pgfmathsetmacro{\anglefinal}{secttoangle(\cursectinit-1)+\astep/2}

  \foreach \percent in {25,50,75}{
    \pgfmathsetmacro{\dist}{\min+(\max-\min)/100*\percent}
    \draw[white,thick] (\angleinit:\dist pt)
    arc(\angleinit:\anglefinal:\dist pt);
    \node[font=\tiny\bfseries,rotate=secttoangle(-1)]
    at ({secttoangle(-1)}:\dist pt) {\percent\%};
  }

\end{tikzpicture}
\end{document}
第一个版本
这是 TikZ 极坐标直方图的示例。

\documentclass{standalone}
\usepackage{tikz}
\usepackage{ifthen}
\tikzset{
  hist 1/.style={fill=orange},
  hist 2/.style={fill=lime},
  hist 3/.style={fill=cyan},
}

\def\astep{6} % width (degree) of each sector
\def\min{5mm} % min distance from center
\def\max{3cm} % max distance from center

\begin{document}
\begin{tikzpicture}[text=white,font=\bfseries]
  \fill[green!30!black] circle(\max+1cm);
  \foreach \curlabel/\values [count=\cp] in {%
    aaa/{10,30,60},
    aab/{20,30,50},
    aba/{30,30,40},
    aad/{40,30,30},
    aca/{50,30,20},
    zcb/{60,10,30},
    aaa/{10,30,60},
    aab/{30,30,40},
    aba/{10,80,10},
    aad/{30,30,40},
    aca/{10,30,60},
    /,
    zcb/{60,10,30},
    zcb/{60,10,30},
    aaa/{10,30,60},
    aab/{30,30,40},
    aba/{10,80,10},
    aad/{30,30,40},
    aca/{10,30,60},
    zcb/{60,10,30},
    zcb/{60,10,30},
    aaa/{10,30,60},
    /,
    aab/{30,30,40},
    aba/{10,80,10},
    aad/{30,30,40},
    aca/{10,30,60},
    zcb/{60,10,30},
    zcb/{60,10,30},
    aaa/{10,30,60},
    aab/{30,30,40},
    aba/{10,80,10},
    aad/{30,30,40},
    aca/{10,30,60},
    zcb/{60,10,30}%
  }{
    \ifthenelse{\equal{\curlabel}{}}{}{
      % angle for this current label
      \pgfmathsetmacro{\angle}{(\cp-1)*\astep-90+\astep/2}
      % distance from center
      \pgfmathsetmacro{\total}{\min}
      \pgfmathsetmacro{\am}{\max-\min}
      \xdef\total{\total}
      % histogram
      \foreach \val [count=\cv] in \values {
        \pgfmathsetmacro{\nexttotal}{\total pt+\am/100*\val}
        % sector
        \filldraw[hist \cv]
        (\angle+\astep/2:\total pt)
        arc(\angle+\astep/2:\angle-\astep/2:\total pt)
        -- (\angle-\astep/2:\nexttotal pt)
        arc(\angle-\astep/2:\angle+\astep/2:\nexttotal pt)
        -- cycle;
        % iteration
        \xdef\total{\nexttotal}
        \typeout{\val:\total}
      }
      % label (with autorotation)
      \pgfmathtruncatemacro{\anglenode}{\angle}
      \ifthenelse{\( \anglenode > 90 \) \AND \( \anglenode < 270 \)}{
        \node[rotate=180+\anglenode,anchor=east] at (\angle:\max) {\curlabel};
      }{
        \node[rotate=\anglenode,anchor=west] at (\angle:\max) {\curlabel};
      }
    }
  }
\end{tikzpicture}
\end{document}
答案2
以下答案使用轮图包,是我写的。
数据首先存储在宏中\WClist。这里,第一个值对应红色部分,第二个值对应黄色部分。
使用密钥获取每个切片之间的间隙gap polar=5。
共有 3 个轮图。第一个绘制红色部分,第二个绘制黄色部分,最后一个绘制绿色部分。
是data月份。它们的旋转和固定取决于 给出的角度\WCmidangle。这是在键 中设置的data style。

\documentclass[border=6pt]{standalone}
\usepackage{wheelchart}
\begin{document}
\begin{tikzpicture}[scale=0.05,white]
\def\WClist{%
  10/30/January,
  20/30/February,
  30/30/March,
  40/30/April,
  50/30/May,
  60/10/June,
  10/30/July,
  30/30/August,
  10/80/September,
  30/30/October,
  10/10/November,
  20/20/December%
}
\pgfkeys{
  /wheelchart,
  data=,
  gap polar=5,
  value=1
}
\def\r{20}
\def\WCdefradius#1{\fpeval{sqrt((#1)*(100-(\r/10)^2)+\r^2)}}
\fill[black] (0,0) circle[radius=110];
\wheelchart[
  radius={\r}{\WCdefradius{\WCvarA}},
  slices style=red
]{\WClist}
\wheelchart[
  radius={\WCdefradius{\WCvarA}}{\WCdefradius{\WCvarA+\WCvarB}},
  slices style=yellow
]{\WClist}
\wheelchart[
  data=\WCvarC,
  data style={
    /utils/exec={
      \pgfmathparse{\WCmidangle<225?1:(\WCmidangle<316?0:1)}
      \ifnum\pgfmathresult=1
        \pgfmathsetmacro{\WCrotate}{\WCmidangle-90}
        \def\WCanchor{south}
      \else
        \pgfmathsetmacro{\WCrotate}{\WCmidangle+90}
        \def\WCanchor{north}
      \fi
    },
    rotate=\WCrotate,
    anchor=\WCanchor
  },
  middle={\huge 2022},
  radius={\WCdefradius{\WCvarA+\WCvarB}}{100},
  slices style=green
]{\WClist}
\foreach\n in {0,...,10}{
  \draw (0,0) circle[radius={\WCdefradius{10*\n}}];
}
\end{tikzpicture}
\end{document}