

我正在制作一个包含 30 个图、5 行 6 列的图形。我想要做的是:在图形的每一行开头写一些文字,但我希望文字是垂直的而不是水平的。对于列,我想写一个文本并将其分组到每两列中,例如在第 1 列和第 2 列的顶部写上 data1,它将位于两列之间。这对我来说真的很难。
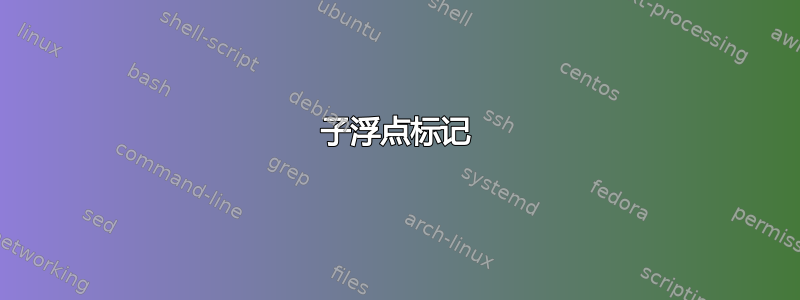
这个图解释了我想在红色标记处放置文本

这是我的代码示例:
\begin{figure*}[t]
\centering
\subfloat[]{\includegraphics[width=.33\linewidth]{../Hussein/MatFiles/Lights/k640_Sensor_Lights_On_1000mm-pgms/k640_Sensor_Lights_On_1000mm-pgms_no_of_levels}}
\subfloat[]{\includegraphics[width=.33\linewidth]{../Hussein/MatFiles/Lights/k640_Sensor_Lights_On_1000mm-pgms/k640_Sensor_Lights_On_1000mm-pgms_entropy}}
\subfloat[]{\includegraphics[width=.33\linewidth]{../Hussein/MatFiles/Lights/k640_Sensor_Lights_On_1000mm-pgms/k640_Sensor_Lights_On_1000mm-pgms_mean}}
\subfloat[]{\includegraphics[width=.33\linewidth]{../Hussein/MatFiles/Lights/x640_Sensor_Lights_On_1000mm-pgms/x640_Sensor_Lights_On_1000mm-pgms_no_of_levels}}
\subfloat[]{\includegraphics[width=.33\linewidth]{../Hussein/MatFiles/Lights/x640_Sensor_Lights_On_1000mm-pgms/x640_Sensor_Lights_On_1000mm-pgms_entropy}}
\subfloat[]{\includegraphics[width=.33\linewidth]{../Hussein/MatFiles/Lights/x640_Sensor_Lights_On_1000mm-pgms/x640_Sensor_Lights_On_1000mm-pgms_mean}}\\
\subfloat[]{\includegraphics[width=.33\linewidth]{../Hussein/MatFiles/Lights/x320_Sensor_Lights_On_1000mm-pgms/x320_Sensor_Lights_On_1000mm-pgms_no_of_levels}}
\subfloat[]{\includegraphics[width=.33\linewidth]{../Hussein/MatFiles/Lights/x320_Sensor_Lights_On_1000mm-pgms/x320_Sensor_Lights_On_1000mm-pgms_entropy}}
\subfloat[]{\includegraphics[width=.33\linewidth]{../Hussein/MatFiles/Lights/x320_Sensor_Lights_On_1000mm-pgms/x320_Sensor_Lights_On_1000mm-pgms_mean}}
\subfloat[]{\includegraphics[width=.33\linewidth]{../Hussein/MatFiles/Lights/x320_Sensor_Lights_On_1000mm-pgms/x320_Sensor_Lights_On_1000mm-pgms_mean}}
\subfloat[]{\includegraphics[width=.33\linewidth]{../Hussein/MatFiles/Lights/x320_Sensor_Lights_On_1000mm-pgms/x320_Sensor_Lights_On_1000mm-pgms_mean}}
\subfloat[]{\includegraphics[width=.33\linewidth]{../Hussein/MatFiles/Lights/x320_Sensor_Lights_On_1000mm-pgms/x320_Sensor_Lights_On_1000mm-pgms_mean}}
\caption{aaa}
\label{fig:rulascore}
\end{figure*}
更新:
我已经更新了“以下”的代码,但没有出现如图所示的内容
使用的代码:
\begin{figure*}
\centering
\subfloat[]{%
\begin{tikzpicture}[remember picture]
  \node[mynode] (image11)
  {\includegraphics[trim=2cm 7cm 2cm 7cm, clip=true,width=.15\linewidth]{../Hussein/MatFiles/Lights/k640_Sensor_Lights_On_1000mm-pgms/k640_Sensor_Lights_On_1000mm-pgms_no_of_levels}};
\end{tikzpicture}}\hfill
\subfloat[]{%
\begin{tikzpicture}[remember picture]
  \node[mynode] (image12)
  {\includegraphics[trim=2cm 7cm 2cm 7cm, clip=true,width=.15\linewidth]{../Hussein/MatFiles/Lights/k640_Sensor_Lights_On_1000mm-pgms/k640_Sensor_Lights_On_1000mm-pgms_entropy}};
\end{tikzpicture}}\hfill
\subfloat[]{%
\begin{tikzpicture}[remember picture]
  \node[mynode] (image13)
  {\includegraphics[trim=2cm 7cm 2cm 7cm, clip=true,width=.15\linewidth]{../Hussein/MatFiles/interference/1500/x320_Sensor_Lights_On_1500mm_with_interference_distance_1100-pgms/x320_Sensor_Lights_On_1500mm_with_interference_distance_1100-pgms_no_of_levels}};
\end{tikzpicture}}\hfill
\subfloat[]{%
\begin{tikzpicture}[remember picture]
  \node[mynode] (image14)
  {\includegraphics[trim=2cm 7cm 2cm 7cm, clip=true,width=.15\linewidth]{../Hussein/MatFiles/interference/1500/x320_Sensor_Lights_On_1500mm_with_interference_distance_1100-pgms/x320_Sensor_Lights_On_1500mm_with_interference_distance_1100-pgms_entropy}};
\end{tikzpicture}}\hfill
\subfloat[]{%
\begin{tikzpicture}[remember picture]
  \node[mynode] (image15)
  {\includegraphics[trim=2cm 7cm 2cm 7cm, clip=true,width=.15\linewidth]{../Hussein/MatFiles/interference/1500/x320_Sensor_Lights_On_1500mm_with_interference_distance_1100-pgms/x320_Sensor_Lights_On_1500mm_with_interference_distance_1100-pgms_no_of_levels}};
\end{tikzpicture}}\hfill
\subfloat[]{%
\begin{tikzpicture}[remember picture]
  \node[mynode] (image16)
  {\includegraphics[trim=2cm 7cm 2cm 7cm, clip=true,width=.15\linewidth]{../Hussein/MatFiles/interference/1500/x320_Sensor_Lights_On_1500mm_with_interference_distance_1100-pgms/x320_Sensor_Lights_On_1500mm_with_interference_distance_1100-pgms_entropy}};
\end{tikzpicture}}\\
\subfloat[]{%
\begin{tikzpicture}[remember picture]
  \node[mynode] (image21)
  {\includegraphics[trim=2cm 7cm 2cm 7cm, clip=true,width=.15\linewidth]{../Hussein/MatFiles/interference/1500/x320_Sensor_Lights_On_1500mm_with_interference_distance_1100-pgms/x320_Sensor_Lights_On_1500mm_with_interference_distance_1100-pgms_no_of_levels}};
\end{tikzpicture}}\hfill
\subfloat[]{\includegraphics[trim=2cm 7cm 2cm 7cm, clip=true,width=.15\linewidth]{../Hussein/MatFiles/interference/1500/x320_Sensor_Lights_On_1500mm_with_interference_distance_1100-pgms/x320_Sensor_Lights_On_1500mm_with_interference_distance_1100-pgms_entropy}}\hfill
\subfloat[]{\includegraphics[trim=2cm 7cm 2cm 7cm, clip=true,width=.15\linewidth]{../Hussein/MatFiles/interference/1500/x320_Sensor_Lights_On_1500mm_with_interference_distance_1100-pgms/x320_Sensor_Lights_On_1500mm_with_interference_distance_1100-pgms_no_of_levels}}\hfill
\subfloat[]{\includegraphics[trim=2cm 7cm 2cm 7cm, clip=true,width=.15\linewidth]{../Hussein/MatFiles/interference/1500/x320_Sensor_Lights_On_1500mm_with_interference_distance_1100-pgms/x320_Sensor_Lights_On_1500mm_with_interference_distance_1100-pgms_entropy}}
\caption{aaa}
\label{fig:rulascore}
\end{figure*}

\begin{tikzpicture}[remember picture,overlay]
\node[above] at ( $ (image11.north)!0.5!(image12.north) $ ) {some text goes here};
\node[above] at ( $ (image13.north)!0.5!(image14.north) $ ) {some text goes here};
\node[above] at ( $ (image15.north)!0.5!(image16.north) $ ) {some text goes here};
\node[rotate=90,yshift=10pt] at (image11.west) {some text};
\node[rotate=90,yshift=10pt] at (image21.west) {some text};
\end{tikzpicture}
答案1
这是一种使用的可能性TikZ;想法是将第一行和第一列的每个图形放在一个命名节点内,然后使用这些节点放置文本:
\documentclass{article}
\usepackage{subfig}
\usepackage[demo]{graphicx}
\usepackage{tikz}
\usetikzlibrary{calc}

\tikzset{
  mynode/.style={anchor=south west,inner sep=0,outer sep=0pt}}

\begin{document}

\begin{figure*}
\centering
\subfloat[]{%
\begin{tikzpicture}[remember picture]
  \node[mynode] (image11)
  {\includegraphics[width=.15\textwidth]{../Hussein/MatFiles/Lights/k640_Sensor_Lights_On_1000mm-pgms/k640_Sensor_Lights_On_1000mm-pgms_no_of_levels}};
\end{tikzpicture}}\hfill
\subfloat[]{%
\begin{tikzpicture}[remember picture]
  \node[mynode] (image12)
  {\includegraphics[width=.15\textwidth]{../Hussein/MatFiles/Lights/k640_Sensor_Lights_On_1000mm-pgms/k640_Sensor_Lights_On_1000mm-pgms_entropy}};
\end{tikzpicture}}\hfill
\subfloat[]{%
\begin{tikzpicture}[remember picture]
  \node[mynode] (image13)
  {\includegraphics[width=.15\textwidth]{../Hussein/MatFiles/Lights/k640_Sensor_Lights_On_1000mm-pgms/k640_Sensor_Lights_On_1000mm-pgms_mean}};
\end{tikzpicture}}\hfill
\subfloat[]{%
\begin{tikzpicture}[remember picture]
  \node[mynode] (image14)
  {\includegraphics[width=.15\textwidth]{../Hussein/MatFiles/Lights/x640_Sensor_Lights_On_1000mm-pgms/x640_Sensor_Lights_On_1000mm-pgms_no_of_levels}};
\end{tikzpicture}}\hfill
\subfloat[]{%
\begin{tikzpicture}[remember picture]
  \node[mynode] (image15)
  {\includegraphics[width=.15\textwidth]{../Hussein/MatFiles/Lights/x640_Sensor_Lights_On_1000mm-pgms/x640_Sensor_Lights_On_1000mm-pgms_entropy}};
\end{tikzpicture}}\hfill
\subfloat[]{%
\begin{tikzpicture}[remember picture]
  \node[mynode] (image16)
  {\includegraphics[width=.15\textwidth]{../Hussein/MatFiles/Lights/x640_Sensor_Lights_On_1000mm-pgms/x640_Sensor_Lights_On_1000mm-pgms_mean}};
\end{tikzpicture}}\\
\subfloat[]{%
\begin{tikzpicture}[remember picture]
  \node[mynode] (image21)
  {\includegraphics[width=.15\textwidth]{../Hussein/MatFiles/Lights/x320_Sensor_Lights_On_1000mm-pgms/x320_Sensor_Lights_On_1000mm-pgms_no_of_levels}};
\end{tikzpicture}}\hfill
\subfloat[]{\includegraphics[width=.15\textwidth]{../Hussein/MatFiles/Lights/x320_Sensor_Lights_On_1000mm-pgms/x320_Sensor_Lights_On_1000mm-pgms_entropy}}\hfill
\subfloat[]{\includegraphics[width=.15\textwidth]{../Hussein/MatFiles/Lights/x320_Sensor_Lights_On_1000mm-pgms/x320_Sensor_Lights_On_1000mm-pgms_mean}}\hfill
\subfloat[]{\includegraphics[width=.15\textwidth]{../Hussein/MatFiles/Lights/x320_Sensor_Lights_On_1000mm-pgms/x320_Sensor_Lights_On_1000mm-pgms_mean}}\hfill
\subfloat[]{\includegraphics[width=.15\textwidth]{../Hussein/MatFiles/Lights/x320_Sensor_Lights_On_1000mm-pgms/x320_Sensor_Lights_On_1000mm-pgms_mean}}\hfill
\subfloat[]{\includegraphics[width=.15\textwidth]{../Hussein/MatFiles/Lights/x320_Sensor_Lights_On_1000mm-pgms/x320_Sensor_Lights_On_1000mm-pgms_mean}}
\caption{aaa}
\label{fig:rulascore}
\end{figure*}

\begin{tikzpicture}[remember picture,overlay]
\node[above] at ( $ (image11.north)!0.5!(image12.north) $ ) {some text goes here};
\node[above] at ( $ (image13.north)!0.5!(image14.north) $ ) {some text goes here};
\node[above] at ( $ (image15.north)!0.5!(image16.north) $ ) {some text goes here};
\node[rotate=90,yshift=10pt] at (image11.west) {some text};
\node[rotate=90,yshift=10pt] at (image21.west) {some text};
\end{tikzpicture}

\end{document}

选项demo只是graphicx用黑色矩形替换实际图形;不是在实际文档中使用该选项。
与问题没有直接关系,但您的图像对于文本区域宽度来说太宽了(或者您可能正在使用编写两列文档?);无论如何,我将宽度从 更改为 ,0.33\linewidth并0.15\textwidth使用\hfill均匀分隔每行中的图形(当然,您可以恢复这些更改)。此外,[t]的选项figure可能过于严格;我从我的示例中删除了它。