

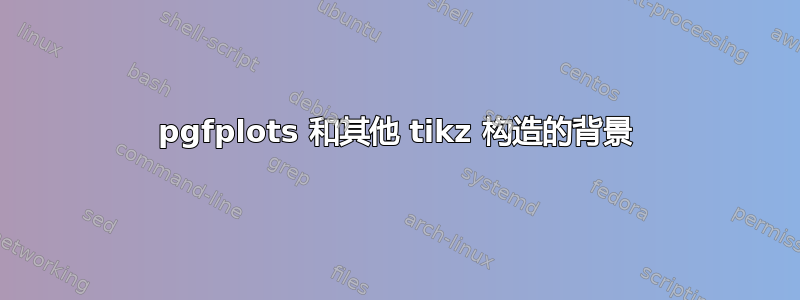
答案ybar 堆叠会干扰 tikz 背景提出了进一步的问题,我解决了其中的一些问题。注释掉背景后,下面的 MWE 生成了此图像:

看了背景评论,我明白了

- 背景在情节的后面,却遮住了我精心贴上的标签。
- 背景图像必须位于所有内容(包括单独放置的标题和图例)的后面且略大于所有内容。固定的:使背景成为节点就成功了。
- 参差不齐的边缘应适用于整个背景图像。固定的
最后,应尽可能多地计算位置,而不是通过反复试验。我已经将大部分尺寸和位置隔离在宏中,但它们仍然都是硬编码的。
我知道这不止一个问题,但在我看来,这些问题自然而然地被归为一类。像我一样需要其中一个问题的答案的人,可能需要所有问题的答案。
MWE(由于它包含我的真实数据,因此不是完全最小的)。
\documentclass[border=5mm]{standalone}
\usepackage{tikz,pgfplots}
\usepackage{pgfplotstable}
\usepackage{mwe}

\usetikzlibrary{calc,decorations.pathmorphing}

%Use the new axis label placement features
\pgfplotsset{compat=1.8}


\usepackage{helvet}
\usepackage[eulergreek]{sansmath}

\begin{document}

\pgfdeclarelayer{background}
\pgfsetlayers{background,main}

\pgfplotstableread[col sep=comma]{
category, mass, other
{dollars\\\$3.14m}, 31, 69
{donors\\56k}, 21, 79
}\warren

\newcommand{\plotsize}{width=6cm, height=5cm}
\newcommand{\boxsize}{(6,5)}
\newcommand{\boxspot}{(-2,-2)}
\newcommand{\titlepos}{(2.0,-1.5)}
\newcommand{\legendpos}{(0.17, -0.02)} %fraction of plotsize

\pgfplotsset{every axis legend/.append
  style={at={\legendpos},anchor=north west,fill=none}
}

\tikzset{
pencildraw/.style={ %
    decorate,
    decoration={random steps,segment length=6pt,amplitude=3pt}
    } %
}

\begin{tikzpicture}[font=\sffamily\sansmath]
\path[clip,pencildraw] \boxspot rectangle \boxsize;
\begin{axis}[
    clip=false,
    ybar stacked,
    ymin=0,
    ymax=100,
    bar width=35pt,
    enlarge x limits={abs=20pt},
    \plotsize,
    hide y axis,
    axis x line*=top,
    axis line style={opacity=0},
    xtick style={opacity=0},
    xtick=data,
    xticklabel style={align=center},
    xticklabel pos=upper,
    xticklabels from table={\warren}{category},
    nodes near coords={\pgfmathprintnumber{\pgfplotspointmeta}\%},
    nodes near coords align={anchor=east,xshift=-5.5mm,yshift=-3mm},
    point meta=explicit,
    ]
  \legend{Massachusetts, out of state};
  \addplot [fill=blue] table [x expr =\coordindex, y=mass, meta=mass] {\warren};
  \addplot [fill=yellow] table [x expr =\coordindex, y=other,
    meta=other]{\warren};
\pgfplotsextra{\begin{scope}[on layer=axis background]
   \node{   {\includegraphics[scale=1.5]{example-image-A}}};
\end{scope}}
\end{axis}
\node at \titlepos {\large Elizabeth Warren's Fundraising};
\end{tikzpicture}
\end{document}
答案1
clip=false该问题是由和的组合引起的ybar stacked:由于某种原因,这会导致nodes near coords消失(在我看来像是一个错误)。
您可以通过先将纸张节点放置在轴外来避免此问题。这样,所有内容将自动绘制在纸张背景之上,而无需使用图层:

\documentclass[border=5mm]{standalone}
\usepackage{tikz,pgfplots}
\usepackage{pgfplotstable}

\usetikzlibrary{calc,decorations.pathmorphing}

%Use the new axis label placement features
\pgfplotsset{compat=1.8}


\usepackage{helvet}
\usepackage[eulergreek]{sansmath}

\begin{document}

\pgfdeclarelayer{background}
\pgfsetlayers{background,main}

\pgfplotstableread[col sep=comma]{
category, mass, other
{dollars\\\$3.14m}, 31, 69
{donors\\56\,000}, 21, 79
}\warren

\newcommand{\plotsize}{width=6cm, height=5cm}
\newcommand{\boxsize}{(6,5)}
\newcommand{\boxspot}{(-2,-2)}
\newcommand{\titlepos}{(2.0,-1.5)}
\newcommand{\legendpos}{(0.17, -0.02)} %fraction of plotsize

\pgfplotsset{every axis legend/.append
  style={at={\legendpos},anchor=north west,fill=none}
}

\tikzset{
pencildraw/.style={ %
    decorate,
    decoration={random steps,segment length=6pt,amplitude=3pt}
    } %
}

\begin{tikzpicture}[font=\sffamily\sansmath]
\path[clip,pencildraw] \boxspot rectangle \boxsize;
\node{
    \includegraphics[scale=1.5]{newsprint}
};
\begin{axis}[
    ybar stacked,
    ymin=0,
    ymax=100,
    bar width=35pt,
    enlarge x limits={abs=20pt},
    \plotsize,
    hide y axis,
    axis x line*=top,
    axis line style={opacity=0},
    xtick style={opacity=0},
    xtick=data,
    xticklabel style={align=center, on layer=axis foreground},
    xticklabel pos=upper,
    xticklabels from table={\warren}{category},
    nodes near coords={\pgfmathprintnumber{\pgfplotspointmeta}\%},
    nodes near coords align={anchor=east,xshift=-5.5mm,yshift=-3mm},
    point meta=explicit,
    ]
  \legend{Massachusetts, out of state};
  \addplot [fill=blue] table [x expr =\coordindex, y=mass, meta=mass] {\warren};
  \addplot [fill=yellow] table [x expr =\coordindex, y=other,
    meta=other]{\warren};
\end{axis}
\node at \titlepos {\large Elizabeth Warren's Fundraising};
\end{tikzpicture}
\end{document}