

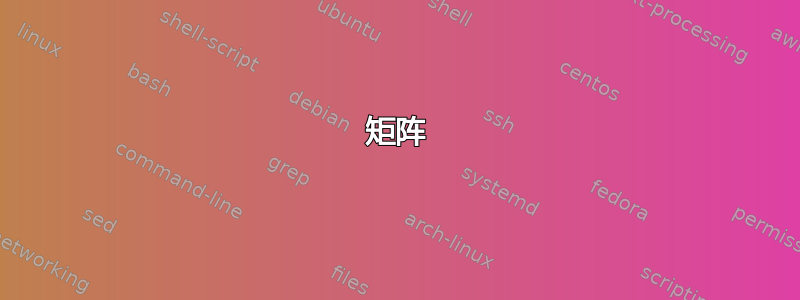
我正在尝试重现下图:

我想知道我应该用什么来生成这个。我可以制作矩阵,这很简单,但让箭头正确才是困难的……使用起来会很有趣这个例子,其中 S_{ij} 是带圆圈的节点,然后有些节点没有连接,而椭圆和 S_i: 是节点,但它们不会被圈起来。我正在寻找这里,我认为这也会起作用,但我还不知道如何解释(mij)符号,或者如何将箭头连接到节点。
到目前为止,我得到以下内容:

\documentclass{article}
\usepackage{tikz}
\usetikzlibrary{arrows}
\begin{document}
\begin{tikzpicture}[->,>=stealth',shorten >=1pt,auto,node distance=3cm,
  thick,main node/.style={circle,fill=blue!20,draw,font=\sffamily\Large\bfseries}]

\node[main node] (1) {$S_{11}$};
\node[main node] (2) [right of=1] {$S_{12}$};
\node[main node] (3) [below of=1] {$S_{21}$};
\node[main node] (4) [below of=3] {$S_{31}$};
\node[main node] (5) [below of=2] {$S_{22}$};
\node[main node] (6) [right of=2] {$S_{13}$};
\node[main node] (7) [right of=6] {$S_{14}$};
\node[main node] (8) [below of=6] {$S_{23}$};
\node[main node] (9) [below of=5] {$S_{32}$};
\node[main node] (10) [below of=4] {$S_{41}$};

\node[main node] (11) [right of=10] {$S_{42}$};
\node[main node] (12) [right of=11] {$S_{43}$};
\node[main node] (13) [right of=12] {$S_{44}$};
\node[main node] (14) [right of=9] {$S_{33}$};
\node[main node] (15) [right of=14] {$S_{34}$};
\node[main node] (16) [right of=8] {$S_{24}$};

  \path[every node/.style={font=\sffamily\small}]
(1) edge node [right] {} (2)
(2) edge node [right] {} (3)
(3) edge node [right] {} (4)
(4) edge node [right] {} (5)
(5) edge node [right] {} (6)
(6) edge node [right] {} (7)
(7) edge node [right] {} (8)
(8) edge node [right] {} (9)
(9) edge node [right] {} (10);

\end{tikzpicture}
\end{document}
答案1
正如 Qrrbrbirlbel 所评论的,您可以使用该\matrix命令。库matrix of math nodes中的选项matrix将通过在每个单元格中自动打开数学模式来节省您的一些输入。当您命名矩阵时(m),您可以使用语法来引用该矩阵的行和列(m-i-j)中的单元格。要连接节点,只需在设置矩阵后绘制边缘即可。ij
\documentclass{article}
\usepackage{tikz}
\usetikzlibrary{matrix}

\begin{document}

\begin{tikzpicture}
\matrix(m)[matrix of math nodes,column sep=1cm,row sep=1cm]{
    s_{11} & s_{12} & s_{13} & s_{14} & \cdots \\
    s_{21} & s_{22} & s_{23} & s_{24} & \cdots \\
    s_{31} & s_{32} & s_{33} & s_{34} & \cdots \\
    s_{41} & s_{42} & s_{43} & \cdots \\
};

\draw[->]
         (m-1-1)edge(m-1-2)
         (m-1-2)edge(m-2-1)
         (m-2-1)edge(m-3-1)
         (m-3-1)edge(m-2-2)
         (m-2-2)edge(m-1-3)
         (m-1-3)edge(m-1-4)
         (m-1-4)edge(m-2-3)
         (m-2-3)edge(m-3-2)
         (m-3-2)edge(m-4-1);
\end{tikzpicture}

\end{document}

答案2
这是一个自动绘制边缘的解决方案;无需逐一指定它们!
您可以根据需要将图表放大:只需通过更改正整数的值来指定所需的节点数\N。
注意:如果未能babel使用该english选项加载包,则会产生错误。请参阅tikz-uml 序列图“Extra \or”错误更多细节。
编辑: 也可以看看Qrrbrbirlbel 的“链条”解决方案,精神上和我的很相似。


\documentclass{article}
\usepackage[english]{babel}
\usepackage{etoolbox}
\usepackage{pgfplots}
\usetikzlibrary{arrows}
\begin{document}
\begin{tikzpicture}%
[
    ->,
    >=stealth',
    scale=2,
    auto,
  thick,
  main node/.style=%
  {
%   circle,
%   fill=blue!20,
%   draw,
    font=\sffamily\Large\bfseries,
  }
]
\pgfmathtruncatemacro\N{10}
\pgfmathtruncatemacro\i{1}
\pgfmathtruncatemacro\j{1}

\node[main node] at (\j,-\i) (n1) {$S_{\i\j}$};

\pgfplotsforeachungrouped \current in {1,2,...,\N-1}%
{
    \pgfmathtruncatemacro\next{\current+1}
    \ifnum\i=1% (first row)
        \ifnumodd{\j}%
        {   % Go East
            \pgfmathtruncatemacro\j{\j+1}
        }{% Go South West
            \pgfmathtruncatemacro\i{\i+1}
            \pgfmathtruncatemacro\j{\j-1}
        }
    \else%
        \ifnum\j=1% (first column)
            \ifnumodd{\i}%
            { % Go North East
                \pgfmathtruncatemacro\i{\i-1}
                \pgfmathtruncatemacro\j{\j+1}
            }{% Go South
                \pgfmathtruncatemacro\i{\i+1}
            }
        \else
            \pgfmathtruncatemacro{\ijsum}{\i+\j}
            \ifnumodd{\ijsum}%
            { % Go South West
                \pgfmathtruncatemacro\i{\i+1}
                \pgfmathtruncatemacro\j{\j-1}
            }{% Go North East
                \pgfmathtruncatemacro\i{\i-1}
                \pgfmathtruncatemacro\j{\j+1}
            }
        \fi
    \fi
    \node[main node] at (\j,-\i) (n\next) {$S_{\i\j}$};
    \draw (n\current) -- (n\next);
}
\end{tikzpicture}
\end{document}
答案3
矩阵
看来 TikZ\matrix是这里最简单的方法。
结合自动execute at empty cell填充矩阵和continous edges to样式,您可以非常快速地创建此图表。
不过,箭头遵循的模式也可以自动化:
这是通过键matrix connector urr(上-右,右)和matrix connector ldd(左-下,下)完成的,这些键启动依赖于矩阵中命名节点的搜索算法。
代码
\documentclass[tikz,convert=false]{standalone}
\usetikzlibrary{matrix}
\makeatletter
\tikzset{
  @continous edges to/.style={insert path={edge (#1) (#1)}},
  continous edges to/.style={@continous edges to/.list={#1}},
  matrix connector urr/.code args={#1-#2-#3}{%
    \pgfutil@ifundefined{pgf@sh@ns@#1-\the\numexpr#2-1\relax-\the\numexpr#3+1\relax}{%
      \pgfutil@ifundefined{pgf@sh@ns@#1-#2-\the\numexpr#3+1\relax}{}{
        \tikzset{insert path={(#1-#2-#3) edge (#1-#2-\the\numexpr#3+1\relax)},
                 matrix connector ldd/.expanded={#1-#2-\the\numexpr#3+1\relax}}%
      }%
    }{%
      \tikzset{insert path={(#1-#2-#3) edge (#1-\the\numexpr#2-1\relax-\the\numexpr#3+1\relax)},
               matrix connector urr/.expanded={#1-\the\numexpr#2-1\relax-\the\numexpr#3+1\relax}}%
    }
  },
  matrix connector ldd/.code args={#1-#2-#3}{%
    \pgfutil@ifundefined{pgf@sh@ns@#1-\the\numexpr#2+1\relax-\the\numexpr#3-1\relax}{%
      \pgfutil@ifundefined{pgf@sh@ns@#1-\the\numexpr#2+1\relax-#3}{}{%
        \tikzset{insert path={(#1-#2-#3) edge (#1-\the\numexpr#2+1\relax-#3)},
                 matrix connector urr/.expanded={#1-\the\numexpr#2+1\relax-#3}}%
      }%
    }{%
      \tikzset{insert path={(#1-#2-#3) edge (#1-\the\numexpr#2+1\relax-\the\numexpr#3-1\relax)},
               matrix connector ldd/.expanded={#1-\the\numexpr#2+1\relax-\the\numexpr#3-1\relax}}%
    }
  },
}
\makeatother
\begin{document}
\begin{tikzpicture}
\matrix (m) [
  matrix of nodes,
  nodes={
    shape=circle,
    inner sep=+.1667em,% half the default value
  },
  execute at empty cell={\node {$S_{\the\pgfmatrixcurrentrow\the\pgfmatrixcurrentcolumn}$};},
  row sep=2em,
  column sep=2em
] {
  & & & \\
  & & & \\
  & & & \\
  & & & \\
};
\path[->, ultra thick, matrix connector urr={m-1-1}];
\path[->,white, shorten >=2\pgflinewidth] (m-1-1) [continous edges to={m-1-2, m-2-1, m-3-1, m-2-2, m-1-3, m-1-4, m-2-3, m-3-2, m-4-1}];
\end{tikzpicture}
\end{document}
输出

链条
另一种方法与 Jubobs 的答案类似,可以使用库来实现chains,可以使用库的放置选项positioning(即on grid)node distance进行更好的控制。它仅用于放置连接的节点。
代码
\documentclass[tikz,convert=false]{standalone}
\usetikzlibrary{chains}
\newcommand*{\subscript}[3][]{%
    \ifodd#2
      \the\numexpr#2+1-#3\relax#1#3%
    \else
      #3#1\the\numexpr#2+1-#3\relax
    \fi}
\tikzset{
  zigzag/.code 2 args={%
    \ifnum#1>1
      \ifodd#1
        \ifnum#2=1
          \def\position{below}%
        \else
          \def\position{above right}%
        \fi
      \else
        \ifnum#2=1
          \def\position{right}%
        \else
          \def\position{below left}%
        \fi
      \fi
      \tikzset{\position=of \tikzchainprevious}
    \fi
  },
  zigzag*/.code={%
    \edef\llevel{\number\tikzchaincount}%
    \pgfmathloop
      \edef\testllevel{\the\numexpr\llevel-\pgfmathcounter\relax}%
      \ifnum1>\testllevel\relax
        \let\level\pgfmathcounter
      \else
        \let\llevel\testllevel
    \repeatpgfmathloop
    \tikzset{zigzag=\level\llevel}%
  }
}
%
\tikzset{
  every label/.append style={inner sep=+0pt, outer sep=+0pt, font=\tiny},
  label position=above left,
  every join/.append style={-latex},
}
\begin{document}
\begin{tikzpicture}[
  start chain=ch going {zigzag=\level\llevel},
  node distance=.75cm and 1cm,
  every on chain/.append style={
    join, label={(\number\tikzchaincount)}}]
\foreach \level in {1,...,4}
  \foreach \llevel in {1,...,\level}
    \node[on chain=ch] {$S_{\subscript[,]\level\llevel}$};
\end{tikzpicture}
\begin{tikzpicture}[
  on grid, node distance=1cm and 1.5cm, start chain=ch placed zigzag*,
  every on chain/.append style={
    circle, inner sep=+.1667em, text depth=+0pt, text height=+1.5ex,
    join, label/.expanded={(\noexpand\subscript[/]{\level}{\llevel})}}]
\foreach \cnt in {a,...,f} \node[on chain=ch] {\cnt};
\foreach \cnt in {G,...,M} \node[on chain=ch] {\cnt};
\end{tikzpicture}
\end{document}
输出

