

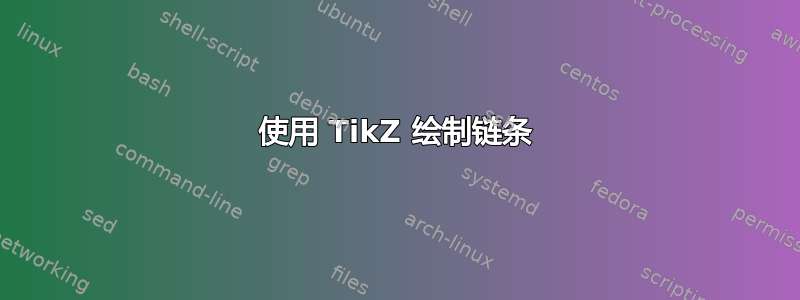
我在回答一组问题时发现了这张图片。由于我刚开始学习 TikZ,所以我无法画出它。

答案1
剪辑,需要我的paths.ortho图书馆。
改进/问题
- 没有考虑线宽。
- 使用键而不是参数。
- 钥匙还可以帮助计算一些事情。
- 递归。
- 添加缺失的上下环。
代码
\documentclass[tikz]{standalone}
\usetikzlibrary{paths.ortho}
\newcommand*\chainy[8]{% #1 = upper center       | #2 = lower center
                       % #3 = upper outer radius | #5 = lower outer radius
                       % #4 = upper inner radius | #6 = lower inner radius
                       % #7 = upper options      | #8 = lower options
\scope
  \clip (#1) -- ++(right:{#4}) arc[radius={#4}, start angle=0, delta angle=-90] --cycle
    ([shift=(right:{#3})] #1) coordinate (@)
    arc[radius={#3}, start angle=0, delta angle=-90] -- (#2) -- ++(right:{#5}) rl (@);
  \path[even odd rule, #8] (#2) circle [radius={#5}] (#2) circle [radius={#6}];
\endscope
\scope
  \clip (#2) -- ++(left:{#6}) arc[radius={#6}, start angle=180, delta angle=-90] --cycle
    ([shift=(left:{#5})] #2) coordinate (@)
    arc[radius={#5}, start angle=180, delta angle=-90] -- (#1) -- ++(left:{#3}) lr (@);
  \path[even odd rule, #7] (#1) circle [radius={#3}] (#1) circle [radius={#4}];
\endscope
\scope
  \clip (#1) rectangle ++ ({#3},{-#3});
  \path[even odd rule, #7] (#1) circle [radius={#3}] (#1) circle [radius={#4}];
\endscope
\scope
  \clip (#2) rectangle ++ ({-#5},{#5});
  \path[even odd rule, #8] (#2) circle [radius={#5}] (#2) circle [radius={#6}];
\endscope
}
\begin{document}
\begin{tikzpicture}[
  udlr/rl distance=+0pt, udlr/lr distance=+0pt,
  y=5mm, x=5mm, a/.style={fill=blue}, b/.style={fill=red}]
  \chainy{0,0}  {0,-9} {6}{5}{5}{4}{a}{b}
  \chainy{0,-9} {0,-16}{5}{4}{4}{3}{b}{a}
  \chainy{0,-16}{0,-21}{4}{3}{3}{2}{a}{b}
  \chainy{0,-21}{0,-24}{3}{2}{2}{1}{b}{a}
\end{tikzpicture}
\end{document}
输出

答案2
需要一些时间xelatex。您可以通过修改来减少计算的多边形数量ngrid。r1是环的外半径和r0环本身的半径:
\documentclass[border=5mm,pstricks,dvipsnames]{standalone}
\usepackage{pst-solides3d}
\begin{document}

\begin{pspicture}[solidmemory](-3,-7)(3,10.2)
\psset{lightsrc=viewpoint,viewpoint=40 -10 0 rtp2xyz,Decran=100,ngrid=18 30,
       object=tore,r0=0.2,action=none}
\psSolid[r1=1,  RotY=90,        fillcolor=blue,  name=R1](0,0,3)
\psSolid[r1=0.9,RotX=90,RotZ=30,fillcolor=Brown, name=R2](0,0,1.5)
\psSolid[r1=0.8,RotY=90,        fillcolor=red,   name=R3](0,0,0.1)
\psSolid[r1=0.7,RotX=90,RotZ=30,fillcolor=yellow,name=R4](0,0,-1)
\psSolid[r1=0.6, RotY=90,        fillcolor=green,name=R5](0,0,-2)
\psSolid[object=fusion,base=R1 R2 R3 R4 R5, action=draw**]
\end{pspicture}

\end{document}

答案3
推荐使用 PSTricks 的解决方案。代码使用的按键越少,代码的可读性就越高,代码的维护也就越容易。
\documentclass[pstricks,border=20pt]{standalone}
\SpecialCoor
\psset{linewidth=.4,linecap=1}
\def\Atom#1#2#3#4#5{%
    \rput(0,#5){%
        \psarc[linecolor=#1](0,#3){!#3 .2 add}{180}{270}%
        \psarc[linecolor=#2](0,-#4){!#4 .2 add}{0}{180}%
        \psarc[linecolor=#1](0,#3){!#3 .2 add}{270}{360}%
    }%
}
\begin{document}
\begin{pspicture}(-4,-12.5)(4,4)
    \Atom{red}{blue}{4}{3}{0}
    \Atom{blue}{red}{3}{2}{-6}
    \Atom{red}{blue}{2}{1}{-10}
    \Atom{blue}{red}{1}{.5}{-12}
\end{pspicture}
\end{document}

答案4
原始绘图似乎不成比例,但无论如何,这需要库的最新 CVSPGF版本math。
下面显示了两个版本。在第一个版本中,每个环的右半部分首先按“从上到下”的顺序绘制,左半部分则按“从下到上”的顺序绘制。
\documentclass[border=0.125cm]{standalone}

\usepackage{tikz}
\usetikzlibrary{math}

\begin{document}

\begin{tikzpicture}[x=2.5pt, y=2.5pt, line cap=round, thick, font=\sf, >=stealth]
\tikzmath{
    %
    % Thickness
    \t = 1;
    % Outer Diameters
    let \D = {{20, 16, 12, 8}};
    %
    \y = 0;
    \s = 0.5;
    %
    int \i;
    for \i in {0,...,3}{
        \r =  \D[\i]/2;
        if (\i > 0) then {
            \y = \y - \r - \D[\i-1]/2 + 2*\t + \s;
        };
        \p = int(mod(\i,2)*100);
        {
            \fill [orange!\p!red] (0,\y) ++(90:\r) arc (90:-90:\r)  -- ++(0,\t) arc (-90:90:\r-\t) -- cycle;
        };
    };
    for \i in {3,...,0}{
        \r =  \D[\i]/2;
        if (\i < 3) then {
            \y = \y + \r + \D[\i+1]/2 - 2*\t - \s;
        };
        \p = int(mod(\i,2)*100);
        {
            % Overlap the arcs so no white lines in PDF viewers
            \fill [orange!\p!red] (0,\y) ++(85:\r) arc (85:275:\r)  -- ++(0,\t) arc (275:85:\r-\t) -- cycle;
        };
    };
    int \M;
    \M1 = \D[0];
    \M2 = \D[0] - 2*\t;
}

\draw [thick] (0, \M1/2)  -- ++(+20,0) ++(-5, 0) coordinate (a1);
\draw [thick] (0, -\M1/2) -- ++(+20,0) ++(-5, 0) coordinate (a2);

\draw [thick] (0, \M2/2)  -- ++(-20,0) ++(5, 0) coordinate (b1);
\draw [thick] (0, -\M2/2) -- ++(-20,0) ++(5, 0) coordinate (b2);

\draw [<->] (a1) -- (a2) node [midway, right] {\M1};
\draw [<->] (b1) -- (b2) node [midway, left] {\M2};

\end{tikzpicture}

\end{document}

但上面使用的“两遍”系统效率有点低。这是一个使用层的版本,因此可以“一次性”绘制环:
\documentclass[border=0.125cm]{standalone}

\usepackage{tikz}
\usetikzlibrary{math}
\pgfdeclarelayer{background}
\pgfsetlayers{background,main}
\begin{document}

\begin{tikzpicture}[x=2.5pt, y=2.5pt, line cap=round, thick, font=\sf, >=stealth]
\tikzmath{
    %
    % Thickness
    \t = 1;
    % Outer Diameters
    let \D = {{20, 16, 12, 8}};
    %
    \y = 0;
    \s = 0.5;
    %
    int \i;
    for \i in {0,...,3}{
        \r =  \D[\i]/2;
        if (\i > 0) then {
            \y = \y - \r - \D[\i-1]/2 + 2*\t + \s;
        };
        \p = int(mod(\i,2)*100);
        {
            \fill [orange!\p!red] (0,\y) ++(90:\r) arc (90:360:\r)  -- ++(-\t, 0) arc (360:90:\r-\t) -- cycle;
            \begin{pgfonlayer}{background}
                \fill [orange!\p!red] (0,\y) ++(95:\r) arc (95:-5:\r)  -- ++(-5:-\t) arc (-5:95:\r-\t) -- cycle;
            \end{pgfonlayer}
        };
    };
    int \M;
    \M1 = \D[0];
    \M2 = \D[0] - 2*\t;
}

\draw [thick] (0, \M1/2)  -- ++(+20,0) ++(-5, 0) coordinate (a1);
\draw [thick] (0, -\M1/2) -- ++(+20,0) ++(-5, 0) coordinate (a2);

\draw [thick] (0, \M2/2)  -- ++(-20,0) ++(5, 0) coordinate (b1);
\draw [thick] (0, -\M2/2) -- ++(-20,0) ++(5, 0) coordinate (b2);

\draw [<->] (a1) -- (a2) node [midway, right] {\M1};
\draw [<->] (b1) -- (b2) node [midway, left] {\M2};

\end{tikzpicture}

\end{document}
结果和以前一样。
或者...
\documentclass[border=0.125cm]{standalone}

\usepackage{tikz}
\usetikzlibrary{math}
\pgfdeclarelayer{background}
\pgfsetlayers{background,main}

\newbox\ringbox
\def\ring#1#2#3#4{%
    \def\ringColor{#1}%
    \def\radius{#2}%
    \def\ringThickness{#3}%
    \def\highlightColor{\ringColor!25!white}
    \def\lowlightColor{\ringColor!35!black}
    \setbox\ringbox=\hbox{%
        \tikzmath{%
            \xf = #4;
            {
                \fill [even odd rule, \ringColor]
                    circle [x radius=\xf*\radius, y radius=\radius]
                    circle [x radius=\xf*\radius-\ringThickness, y radius=\radius-\ringThickness];
            };
            for \l in {0,0.5,...,5}{
                \t = \l*\ringThickness*3;
                \o = 0.05;
                \angleA = 45+\l*5;
                \angleB = 225-\l*5;
                \ry1 = \radius-\ringThickness/10*3;
                \ry2 = \radius-\ringThickness/10*7;
                \rx1 = \ry1 * \xf;
                \rx2 = \ry2 * \xf;
                {
                    \draw [\highlightColor, opacity=\o,line width=\t, line cap=round]
                        (\angleA:\rx1 and \ry1) arc (\angleA:\angleB:\rx1 and \ry1)
                        [rotate=180]
                        (\angleA:\rx2 and \ry2) arc (\angleA:\angleB:\rx2 and \ry2);
                    \draw [\lowlightColor, opacity=\o,line width=\t, line cap=round]
                    (\angleA:\rx2 and \ry2) arc (\angleA:\angleB:\rx2 and \ry2)
                    [rotate=180]
                        (\angleA:\rx1 and \ry1) arc (\angleA:\angleB:\rx1 and \ry1);
                };
            };
        }%
    }%
    \begin{scope}
        \clip (0,0) -- (90:\radius) arc (90:365:\radius) -- cycle;
        \copy\ringbox
    \end{scope}
    \begin{pgfonlayer}{background}
        \begin{scope}
            \clip (0,0) -- (91:\radius) arc (91:0:\radius) -- cycle;
            \copy\ringbox
        \end{scope}
    \end{pgfonlayer}
}

\begin{document}

\begin{tikzpicture}

\ring{red}{10}{2}{1}
\tikzset{shift=(270:10+8-4)}
\ring{orange}{8}{2}{0.875}
\tikzset{shift=(270:8+6-4)}
\ring{red}{6}{2}{1}
\tikzset{shift=(270:6+4-4)}
\ring{orange}{4}{2}{0.875}

\end{tikzpicture}
\end{document}
