

请考虑以下事项
\documentclass{article}
\usepackage{filecontents}
% For tables
\usepackage{pgfplotstable}
\usepackage{booktabs}
\usepackage{array}
\usepackage{etoolbox}
\usepackage{units}
\pgfplotstableset{
%font={\small},
empty cells with={--}, % replace empty cells with ’--’
every head row/.style={before row=\toprule,after row=\midrule},
every last row/.style={after row=\bottomrule}
}
%Separate digits with comma (e.g. 1,000,000)
\usepackage[group-separator={,}]{siunitx}
\sisetup{
detect-all,
detect-inline-family=math,
detect-inline-weight=math,
detect-display-math=true}
\usepackage{amsmath}
\usepackage[osf,sc]{mathpazo}
\begin{filecontents}{testdata.csv}
city, theta, x, y
paris, 30.0, 0.0, 0.0
rome, 60.0, 1.9098, 5.8779
athens, 90.0, 6.9098, 9.5106
seattle, 120.0, 13.09, 9.5106
cairo, 150000, 18.09, 5.8779
jakarta, 180.0, 20.0, 0.0
\end{filecontents}
\pgfplotstableread[col sep=comma]{testdata.csv}{\testdata}
\begin{document}
\pgfplotstabletypeset[
columns/city/.style={string type},
col sep=comma]{\testdata}
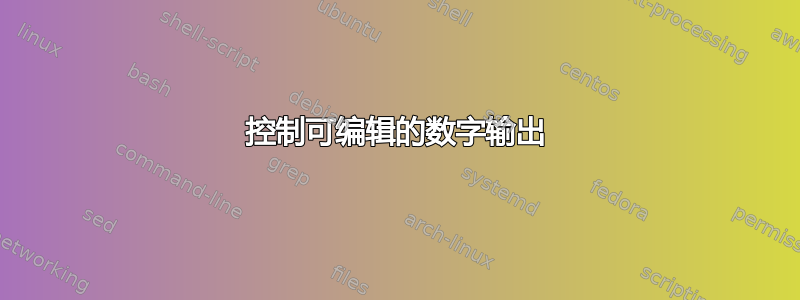
But out of tabular environment and within the \verb!\num! environment numbers are printed as \num{150000}, \num{1.3623}.
\end{document}
带输出

我应该如何控制 打印数字的方式pgfplotstable。我想要获得的是在表格内也拥有与siunitx和定义的相同数字样式。mathpazo
答案1
您可以\num通过设置代码来分配单元格,按如下方式对单元格内容使用宏:

\documentclass{article}

\usepackage{filecontents}

% For tables
\usepackage{pgfplotstable}
\usepackage{booktabs}
\usepackage{array}
\usepackage{etoolbox}
\usepackage{units}

\pgfplotsset{compat=1.9}

\pgfplotstableset{
    %font={\small},
    empty cells with={--}, %  replace empty cells with ’--’
    every head row/.style={before row=\toprule,after row=\midrule},
    every last row/.style={after row=\bottomrule}
}

%Separate digits with comma (e.g. 1,000,000)
\usepackage[group-separator={,}]{siunitx}
\sisetup{
  detect-all,
  detect-inline-family=math,
  detect-inline-weight=math,
  detect-display-math=true}

\usepackage{amsmath}
\usepackage[osf,sc]{mathpazo}

\begin{filecontents}{testdata.csv}
city, theta, x, y
paris, 30.0,   0.0,    0.0
rome, 60.0,   1.9098, 5.8779
athens, 90.0,   6.9098, 9.5106
seattle, 120.0,  13.09,  9.5106
cairo, 150000,  18.09,  5.8779
jakarta, 180.0,  20.0,   0.0
\end{filecontents}

\pgfplotstableread[col sep=comma]{testdata.csv}{\testdata}

\begin{document}

\pgfplotstabletypeset[
  columns/city/.style={string type},
  columns/theta/.style={assign cell
  content/.code={\pgfkeyssetvalue{/pgfplots/table/@cell content}{\num{##1}}}},
  columns/x/.style={assign cell
  content/.code={\pgfkeyssetvalue{/pgfplots/table/@cell content}{\num{##1}}}},
  columns/y/.style={assign cell
  content/.code={\pgfkeyssetvalue{/pgfplots/table/@cell content}{\num{##1}}}},
 col sep=comma]{\testdata}

\medbreak
Out of tabular environment and within the \verb!\num! environment
numbers are printed as \num{150000}, \num{180.0}, \num{1.3623}.

\end{document}