

我正在尝试使用 TikZ 绘制流体路径线、条纹线和流线图。代码
\documentclass{minimal}
\usepackage{tikz}

\begin{document}
\begin{tikzpicture}
  \fill [fill=blue!25] (0.0, 0.0) -- (0.0, 2.0) -- (6.0, 2.0) -- (6.0, 1.0) to[out=180, in=0] (0.0, 0.0);
  \filldraw [semithick, fill=gray!50] (0.0, 2.0) rectangle (6.0, 2.1);
  \filldraw [semithick, fill=gray!50] (0.0, -0.1) -- (0.0, 0.0) to[out=0, in=180] (6.0, 1.0) -- (6.0, 0.9) to[out=180, in=0] (0.0, -0.1);
  %
  \draw [thick] (0.25, 0.25) to[out=0, in=180] node [pos=0.1, above] {$t_{1}$} node [pos=0.5, above] {$t_{2}$} node [pos=0.9, above] {$t_{3}$} (5.75, 1.125);
\end{tikzpicture}
\end{document}
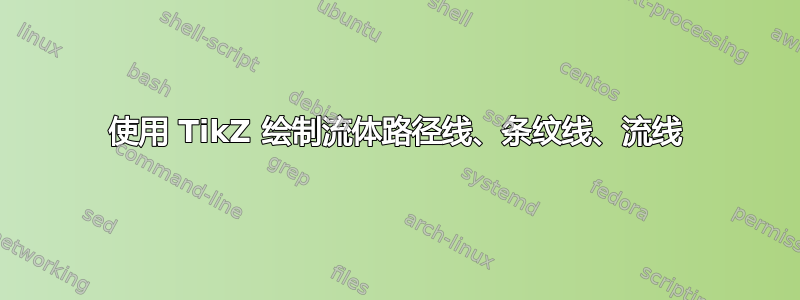
生成以下图像:

我希望标签 $t_{1}$、$t_{2}$ 和 $t_{3}$ 下的位置的黑线上有闭合的圆圈。有人可以建议如何做到这一点吗?谢谢。
答案1
您还可以随时添加额外的节点,一个用于填充圆圈,一个用于标签:

笔记:
- 另请参阅为什么要避免使用最小类?
代码:
\documentclass{article}
\usepackage{tikz}

\begin{document}
\begin{tikzpicture}
  \fill [fill=blue!25] (0.0, 0.0) -- (0.0, 2.0) -- (6.0, 2.0) -- (6.0, 1.0) to[out=180, in=0] (0.0, 0.0);
  \filldraw [semithick, fill=gray!50] (0.0, 2.0) rectangle (6.0, 2.1);
  \filldraw [semithick, fill=gray!50] (0.0, -0.1) -- (0.0, 0.0) to[out=0, in=180] (6.0, 1.0) -- (6.0, 0.9) to[out=180, in=0] (0.0, -0.1);
  %
  \draw [thick] (0.25, 0.25) to[out=0, in=180]
              node [pos=0.1, circle, fill=red, inner sep=2pt] {}
              node [pos=0.1, above] {$t_{1}$}
              node [pos=0.5, circle, fill=blue, inner sep=2pt] {}
              node [pos=0.5, above] {$t_{2}$}
              node [pos=0.9, circle, fill=orange, inner sep=2pt] {}
              node [pos=0.9, above] {$t_{3}$} (5.75, 1.125);
\end{tikzpicture}
\end{document}
答案2
指定内联坐标而不是节点。然后您可以构建稍后需要的任何构造,如下所示:
\documentclass{minimal}
\usepackage{tikz}

\begin{document}
\begin{tikzpicture}
  \fill [fill=blue!25] (0.0, 0.0) -- (0.0, 2.0) -- (6.0, 2.0) -- (6.0, 1.0) to[out=180, in=0] (0.0, 0.0);
  \filldraw [semithick, fill=gray!50] (0.0, 2.0) rectangle (6.0, 2.1);
  \filldraw [semithick, fill=gray!50] (0.0, -0.1) -- (0.0, 0.0)
    to[out=0, in=180] (6.0, 1.0) -- (6.0, 0.9) to[out=180, in=0] (0.0, -0.1);
  %
  \draw [thick] (0.25, 0.25) to[out=0, in=180] coordinate[pos=0.1] (1)
    coordinate[pos=0.5] (2)  coordinate[pos=0.9] (3) (5.75, 1.125);
  \foreach \coord in {1,2,3}{%
    \node[above] at (\coord) {$t_{\coord}$};
    \fill (\coord) circle (2pt);
  }
\end{tikzpicture}
\end{document}
输出为:
