

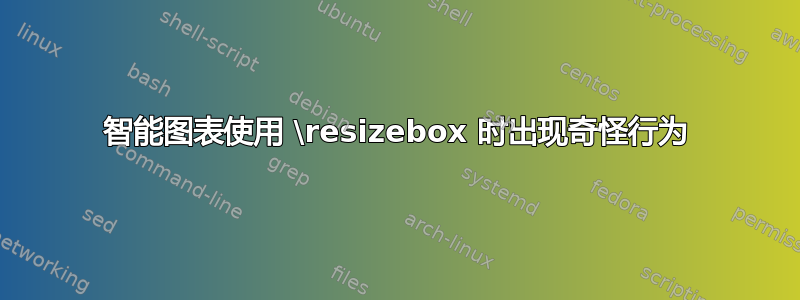
我正在使用 smartdiagram 包。由于我无法指定图表的宽度(或者我可以……?),所以我使用了\resizebox一种解决方法。除了我设置自定义颜色(\setcolorbox...)时,此策略工作正常。尝试更改颜色是如何导致所有这些奇怪的行为的(见图),我该怎么做才能修复它?
梅威瑟:

\documentclass[11pt]{article}
\usepackage[margin=1in]{geometry}
\usepackage{smartdiagram}

\begin{document}

\begin{figure}
\centering
\resizebox{.5\linewidth}{!}{%
\smartdiagramset{
bubble node size =3.5cm,
bubble center node font = \small,
bubble node font = \tiny,
distance center/other bubbles = 1cm,
}
\smartdiagram[bubble diagram]{Traffic Flow\\ Problem,Neuroscience,Computer\\Science,Economics,Mathematics,Engineering, Physics}
}%end resizebox
\end{figure}

\begin{figure}
\centering
\resizebox{.5\linewidth}{!}{%
\smartdiagramset{
bubble node size =3.5cm,
bubble center node font = \small,
bubble node font = \tiny,
distance center/other bubbles = 1cm,
set color list = {red!60, yellow!60, orange!60, green!60, purple!60, cyan!60}
}
\smartdiagram[bubble diagram]{Traffic Flow\\ Problem,Neuroscience,Computer\\Science,Economics,Mathematics,Engineering, Physics}
}%end resizebox
\end{figure}

\end{document}
答案1
MWE 和 package 中的行尾都有相当多不需要的空格smartdiagram。
有时,如果禁用行尾,这会有所帮助,这可以通过 实现\endlinechar=-1。但是有些包会中断(例如tikz),因此示例会smartdiagram预先加载 所需的包。
此外,MWE 中的一些行尾也被注释掉并\box插入以显示图形的边界框。
\documentclass[11pt]{article}
\usepackage[margin=1in]{geometry}

% packages loaded by "smartdiagram"
\RequirePackage{tikz}
\RequirePackage{etoolbox}
\RequirePackage{xparse}
\RequirePackage{xstring}
\usetikzlibrary{backgrounds,
   calc,
   fadings,
   shadows,
   shapes.arrows,
   shapes.symbols
}
\edef\RestoreEndlinechar{%
  \endlinechar=\the\endlinechar\relax
}
\endlinechar=-1
\usepackage{smartdiagram}
\RestoreEndlinechar

\begin{document}

\setlength{\fboxsep}{0pt}
\setlength{\fboxrule}{.1pt}

\begin{figure}
  \centering
  \fbox{%
    \resizebox{.5\linewidth}{!}{%
      \smartdiagramset{
        bubble node size =3.5cm,
        bubble center node font = \small,
        bubble node font = \tiny,
        distance center/other bubbles = 1cm,
      }%
      \smartdiagram[bubble diagram]{%
        Traffic Flow\\Problem,
        Neuroscience,
        Computer\\Science,
        Economics,
        Mathematics,
        Engineering,
        Physics%
      }%
    }% end resizebox
  }% end \fbox
\end{figure}

\begin{figure}
  \centering
  \fbox{%
    \resizebox{.5\linewidth}{!}{%
      \smartdiagramset{
        bubble node size =3.5cm,
        bubble center node font = \small,
        bubble node font = \tiny,
        distance center/other bubbles = 1cm,
        set color list = {red!60, yellow!60, orange!60, green!60, purple!60,
            cyan!60}
      }%
      \smartdiagram[bubble diagram]{%
        Traffic Flow\\Problem,
        Neuroscience,
        Computer\\Science,
        Economics,
        Mathematics,
        Engineering,
        Physics%
      }%
    }% end resizebox
  }%end \fbox
\end{figure}

\end{document}
