

我在手册中寻找这个pgfplots,不幸的是没有提到术语“重新采样”,并且“样本”击中了关键samples,它指的是分析函数,而不是表数据;所以我真的找不到任何参考资料。
考虑一下这个MWE:
\documentclass{article}
\usepackage{pgfplots}
\usepackage{pgfplotstable}
\usetikzlibrary{calc}

\pgfplotstableread[col sep=space,row sep=newline,header=true]{
ts   val
0.0  0.0
1.0  1.0
1.1  4.9
2.0  2.0
2.2  4.9
4.8  0.2
}\mytable

\begin{document}
\begin{tikzpicture}
  \begin{axis}[extra x ticks={3.5}]
\addplot[smooth] table {\mytable};
\addplot[only marks,mark=*,mark options={color=blue}] table {\mytable};
\draw[red] let \p1=(rel axis cs:0,0), \p2=(rel axis cs:1,1), \p3=(axis cs:3.5,0)
  in (\x3,\y1) -- (\x3,\y2);
\end{axis}
\end{tikzpicture}
\end{document}
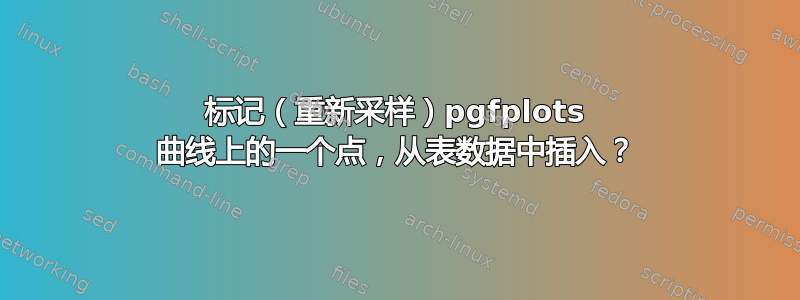
其结果如下:

这里pgfplots在点之间进行插值,形成一条平滑的曲线,但我对线性插值的情况也很感兴趣。基本上,我想知道插值曲线上的点是什么,比如 x=3.5(我们没有样本/数据点),这样我就可以在那里放置一个节点,并可能将一条水平线延伸到 y 轴。
我了解到 pgfplots 只是curveto在点之间进行操作,因此它“不知道”中间的任何插值点。因此似乎可以使用库来intersection实现这一点 - 但我想知道是否有一种“更简单”的方法,比如直接通过数据;所以我有轴 cs 的坐标,如果我还想用坐标值标记该点?
答案1
绘制点很容易。计算 y 坐标稍微困难一些。也许有更简单的方法,但这是我尝试的第一个方法。
\documentclass{article}
\usepackage{pgfplots}
\usepackage{pgfplotstable}
\usetikzlibrary{calc,intersections}

\newlength{\mydima}
\newlength{\mydimb}
\newlength{\mydimc}

\pgfplotstableread[col sep=space,row sep=newline,header=true]{
ts   val
0.0  0.0
1.0  1.0
1.1  4.9
2.0  2.0
2.2  4.9
4.8  0.2
}\mytable

\begin{document}
\begin{tikzpicture}
  \begin{axis}[extra x ticks={3.5}]
\addplot[smooth,name path=mycurve] table {\mytable};
\addplot[only marks,mark=*,mark options={color=blue}] table {\mytable};
\draw[red,name path=mytick] let \p1=(rel axis cs:0,0), \p2=(rel axis cs:1,1), \p3=(axis cs:3.5,0)
  in (\x3,\y1) -- (\x3,\y2);
\fill [red, name intersections={of=mycurve and mytick}]
 (intersection-1) circle (2pt) node {};
\coordinate (A) at (axis cs:0,0);
\coordinate (B) at (axis cs:1,1);
\end{axis}
\pgfextracty{\mydima}{\pgfpointanchor{A}{center}}
\pgfextracty{\mydimb}{\pgfpointanchor{B}{center}}
\pgfextracty{\mydimc}{\pgfpointanchor{intersection-1}{center}}
\pgfmathparse{(\mydimc-\mydima)/(\mydimb-\mydima)}
\edef\yvalue{\pgfmathresult}
\node[right] at (intersection-1) {\yvalue};
\end{tikzpicture}
\end{document}
