

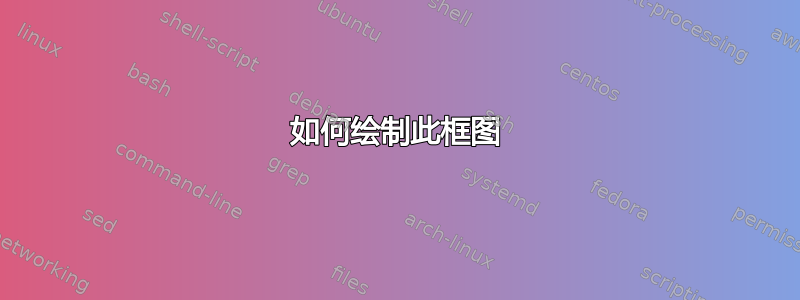
我想画下面的图
我已尽了最大努力,但毫无效果。我的代码不值得在这里发布。我面临的问题是将块放入一个块中,并让它们之间有适当的连接。我试过使用fit,但它不起作用,或者我认为我误用了它。感谢任何帮助。
编辑:
\documentclass{article}
\usepackage{tikz}
\usetikzlibrary{calc,fit,arrows, positioning}
\usepackage{graphicx}
\begin{document}

\noindent\resizebox{\textwidth}{!}{
\begin{tikzpicture}[auto,node distance=5cm,>=stealth']
\tikzset{
block/.style= {draw, rectangle, minimum height=2em,minimum width=4em},
sum/.style = {draw, circle, node distance=2cm},
input/.style  = {coordinate},
output/.style = {coordinate}}

\node [input, name=input](input) {};
\node [sum, right of=input] (sum) {$\sum$};
\node [block, right of=sum, minimum height=6cm, minimum width=8cm] (M) {};

\node [coordinate, below of=M, yshift=1cm] (link1) {};
\node [coordinate, above of=M, yshift=-1cm] (link2) {};


\draw [-] (link1) -- node {} (M) ;
\draw [->] (link2) -- node {} (M) ;
\draw [<-] (sum) |- node[yshift=3cm, xshift=-.5cm] {$text$} (link1) ;


\node [block, right of=M,  rotate=90, minimum width=6cm] (n) {$\textbf{text}$};


\node [block, right of=n, minimum height=6cm, minimum width=5cm] (s) {text};
\node [coordinate, above of=s, yshift=-1cm] (link3) {};
\draw [-] (link3) -- node {} (s) ;
\draw [->] (input) -- node {$text$} (sum);
\draw [->] (sum) -- node {} (M);
\draw [->] (M) -- node {$text$} (n);
\draw [->] (n) -- node {$text$} (s);
\draw [-] (link3) -- node[yshift=.6cm,xshift=-5cm] {text} (link2);

\end{tikzpicture}
}


\end{document}

答案1
这就是您想要的吗?styledefinitionsblock用于水平块,blockB用于垂直块(旋转 90 度)。所有文本短语都通过节点分配,带有诸如above, below, above left, above right等选项,您可能需要进行调整以满足您的需要。
更新:为满足 OP 的需求,进行了小幅修改。添加了一些解释。请参阅 %<---

代码:
\documentclass{article}
\usepackage[margin=1cm]{geometry}
\usepackage{tikz}
\usetikzlibrary{calc,fit,arrows, positioning}
\usepackage{graphicx}
\begin{document}

%\noindent\resizebox{\textwidth}{!}{
\begin{tikzpicture}[auto,node distance=3cm,>=stealth']
\tikzset{
block/.style= {draw, rectangle, minimum height=2em,minimum width=4em},
blockB/.style= {draw, rectangle, minimum height=1cm,minimum width=4cm},
sum/.style = {draw, circle, node distance=2cm},
input/.style  = {coordinate},
output/.style = {coordinate}
}

\node [input, name=input](input) {};
\node [sum, right of=input] (sum1) {$\sum$};
\node [block, right of =  sum1] (t1) {text};
\node [sum, right of =  t1 ] (sum2) {$\sum$};
\node [blockB, node distance=8cm,right of=sum2,  rotate=90] (n1) {$\textbf{text}$};  %<--- the space is determined by the node distance 8cm
\node [block ,minimum height=4cm,right of=n1] (n2) {$\textbf{text}$};                       % <--- to make the horizontal box (block) has the same height of blockB
\node[] at ($(sum2)!0.4!(n1)$) (a) {};
\node [block, above = 1cm of a] (t2) {text};
\node [block, below  = 1cm of  a] (t3) {text};
\node[rectangle, draw, minimum width=7cm,minimum height=7cm][fit=(sum2)(t1)(t2)(t3),label=above:Text](all){};  % change 7cm if want a larger fitting box

\draw [->] (input) -- node {$text$} (sum1);
\draw [->] (sum1) -- node {} (t1);
\draw [->] (t1) -- node {$text$} (sum2);
\draw [<-] (sum2) --++(0,-2cm)node(){text};
\draw [->] (sum2) -- node[pos=0.3] {$text$} (n1);
\draw [->] (n1) -- node[] {text} (n2);
%\draw [->] (n2) -- node[] {text} ++(3,0);   <-- last arrow to the right if still needed remove %
\draw [->] (n2.north)--++(0,2)-|(t2.north)node[above right]{text};  <---  % (0,2) determine the height y=2 of the feedback line
\draw [->] (t2.south) --++ (0,-0.9) to[bend right=90] ++(0,-0.5)--(t3.north);
\draw [->] (t3.south) -- ++(0,-1)-| (sum1.south)node[below left]{text};
\draw [->] (t1.north)--++(0,2)-|node[above left]{text}([xshift=-0.5cm]t2.north);
\end{tikzpicture}
%}
\end{document}

代码
\documentclass{article}
\usepackage[margin=1cm]{geometry}
\usepackage{tikz}
\usetikzlibrary{calc,fit,arrows, positioning}
\usepackage{graphicx}
\begin{document}

%\noindent\resizebox{\textwidth}{!}{
\begin{tikzpicture}[auto,node distance=3cm,>=stealth']
\tikzset{
block/.style= {draw, rectangle, minimum height=2em,minimum width=4em},
blockB/.style= {draw, rectangle, minimum height=1cm,minimum width=4cm},
sum/.style = {draw, circle, node distance=2cm},
input/.style  = {coordinate},
output/.style = {coordinate}
}

\node [input, name=input](input) {};
\node [sum, right of=input] (sum1) {$\sum$};
\node [block, right of =  sum1] (t1) {text};
\node [sum, right of =  t1 ] (sum2) {$\sum$};
\node [blockB, node distance=5cm,right of=sum2,  rotate=90] (n1) {$\textbf{text}$};
\node [blockB,right of=n1,  rotate=90] (n2) {$\textbf{text}$};
\node [] at ($(sum2)!0.4!(n1)$) (a) {};
\node [block, above = 1cm of a] (t2) {text};
\node [block, below  = 1cm of  a] (t3) {text};
\node [rectangle, draw, minimum width=7cm,minimum height=7cm][fit=(sum2)(t1)(t2)(t3),label=above:Text](all){};

\draw [->] (input) -- node {$text$} (sum1);
\draw [->] (sum1)  -- node {} (t1);
\draw [->] (t1)    -- node {$text$} (sum2);
\draw [<-] (sum2)  --++(0,-2cm)node(){text};
\draw [->] (sum2)  -- node {$text$} (n1);
\draw [->] (n1)    -- node[] {text} (n2);
\draw [->] (n2)    -- node[] {text} ++(3,0);
\draw [->] (n2.east)  -- ++(0,3)-|(t2.north)node[above right]{text};
\draw [->] (t2.south) -- ++(0,-0.9) to[bend right=90] ++(0,-0.5)--(t3.north);
\draw [->] (t3.south) -- ++(0,-1)-| (sum1.south)node[below left]{text};
\draw [->] (t1.north) -- ++(0,2)-|node[above left]{text}([xshift=-0.5cm]t2.north);
\end{tikzpicture}
%}
\end{document}