

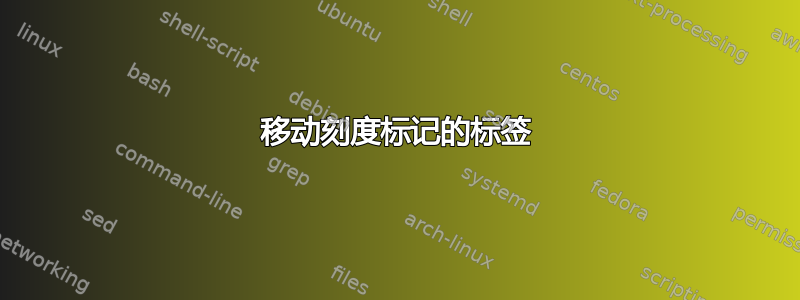
y 轴刻度标记处的标签“ma + b”位于刻度标记的左侧。我希望它位于刻度标记的右侧。(该命令extra y tick labels={$ma+b$,anchor=east}没有移动标签。)
\documentclass[10pt]{amsart}
\usepackage{tikz}
\usetikzlibrary{calc,angles,positioning,intersections,quotes,decorations.markings}
\usepackage{tkz-euclide}
\usetkzobj{all}
\usepackage{pgfplots}
\pgfplotsset{compat=1.11}

\usepackage{amsmath}
\usepackage{amsfonts}
\usepackage{amssymb}
\usepackage{amsthm}


\begin{document}
\noindent\hspace*{\fill}
\begin{tikzpicture}
\begin{axis}[width=4in,axis equal image,
    axis lines=middle,
    xmin=-4,xmax=4,samples=101,
    xlabel=$x$,ylabel=$y$,
    ymin=-7,ymax=5.5,
    restrict y to domain=-7:5.5,
    %enlargelimits={abs=1cm},
    axis line style={latex-latex},
    ticklabel style={font=\tiny,fill=white},
    xtick={\empty},ytick={\empty},
    extra x ticks={-1},
    extra x tick labels={$a$},
    extra y ticks={-3},
    extra y tick labels={$ma+b$,anchor=east},
    xlabel style={at={(ticklabel* cs:1)},anchor=north west},
    ylabel style={at={(ticklabel* cs:1)},anchor=south west}
]
%/pgfplots/xlabel shift={10pt};
\addplot[latex-latex,samples=101,domain=-2.5:3] {2*x - 1} node[right, pos=0.75,font=\footnotesize]{$y = mx + b$};
\draw [fill] (-1,-3) circle [radius=1.5pt];
\end{axis}
\end{tikzpicture}
\hspace{\fill}

\end{document}
答案1
键值对anchor=east无论放置在何处都不会产生任何影响。这是因为它被视为数组中的下一个元素extra y tick labels,但从未被排版,因为中只有一个元素 (-3) extra y ticks。
\hspace{\fill}还请注意,您可以使用而不是\hfill。或者在这种情况下,只需\centering在要居中的组内使用一次即可。
无论如何,这里有一种方法,使用yticklabel style={anchor=west}和yticklabel shift=-4pt。有更好的键可以做到这一点,而无需手动定位,但不幸的是,它们只适用于标准的盒状轴。我还从 MWE 中删除了几个不必要的项目,并调整了方程标签的位置,使其不会在轴的边缘被截断。
\documentclass[10pt]{amsart}
\usepackage{pgfplots}
\pgfplotsset{compat=1.11}

\begin{document}
\centering
\begin{tikzpicture}
\begin{axis}[width=4in,axis equal image,
    axis lines=middle,
    xmin=-4,xmax=4,samples=101,
    xlabel=$x$,ylabel=$y$,
    ymin=-7,ymax=5.5,
    restrict y to domain=-7:5.5,
    %enlargelimits={abs=1cm},
    axis line style={latex-latex},
    ticklabel style={font=\tiny,fill=white},
    xtick={\empty},ytick={\empty},
    extra x ticks={-1},
    extra x tick labels={$a$},
    extra y ticks={-3},
    extra y tick labels={$ma+b$},
    yticklabel style={anchor=west},
    yticklabel shift=-4pt,
    xlabel style={at={(ticklabel* cs:1)},anchor=north west},
    ylabel style={at={(ticklabel* cs:1)},anchor=south west}
]
%/pgfplots/xlabel shift={10pt};
\addplot[latex-latex,samples=101,domain=-2.5:3] {2*x - 1} node[right, pos=0.65,font=\footnotesize]{$y = mx + b$};
\draw [fill] (-1,-3) circle [radius=1.5pt];
\end{axis}
\end{tikzpicture}
\end{document}
