

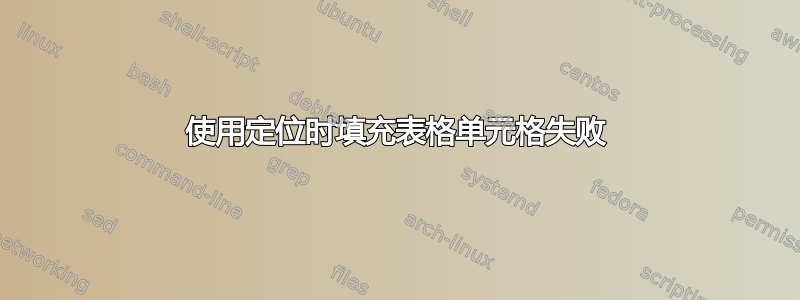
我正在尝试按照代码孵化一些表格单元格这里。它似乎工作正常,但当我将定位更改为时,\begin{table}[!h]阴影不再显示。正确的结果应该如图所示:

这是 MWE:
\documentclass[10pt,a4paper]{article}
\usepackage[usenames,dvipsnames,svgnames,table]{xcolor} % use color
\usepackage{booktabs} % commands for table rules
\usepackage{tikz}
\usetikzlibrary{calc,shadings,patterns}

% Andrew Stacey's code from
% https://tex.stackexchange.com/a/50054/3954
\makeatletter
\tikzset{%
  remember picture with id/.style={%
    remember picture,
    overlay,
    save picture id=#1,
  },
  save picture id/.code={%
    \edef\pgf@temp{#1}%
    \immediate\write\pgfutil@auxout{%
      \noexpand\savepointas{\pgf@temp}{\pgfpictureid}}%
  },
  if picture id/.code args={#1#2#3}{%
    \@ifundefined{save@pt@#1}{%
      \pgfkeysalso{#3}%
    }{
      \pgfkeysalso{#2}%
    }
  }
}

\def\savepointas#1#2{%
  \expandafter\gdef\csname save@pt@#1\endcsname{#2}%
}

\def\tmk@labeldef#1,#2\@nil{%
  \def\tmk@label{#1}%
  \def\tmk@def{#2}%
}

\tikzdeclarecoordinatesystem{pic}{%
  \pgfutil@in@,{#1}%
  \ifpgfutil@in@%
    \tmk@labeldef#1\@nil
  \else
    \tmk@labeldef#1,(0pt,0pt)\@nil
  \fi
  \@ifundefined{save@pt@\tmk@label}{%
    \tikz@scan@one@point\pgfutil@firstofone\tmk@def
  }{%
  \pgfsys@getposition{\csname save@pt@\tmk@label\endcsname}\save@orig@pic%
  \pgfsys@getposition{\pgfpictureid}\save@this@pic%
  \pgf@process{\pgfpointorigin\save@this@pic}%
  \pgf@xa=\pgf@x
  \pgf@ya=\pgf@y
  \pgf@process{\pgfpointorigin\save@orig@pic}%
  \advance\pgf@x by -\pgf@xa
  \advance\pgf@y by -\pgf@ya
  }%
}
\newcommand\tikzmark[2][]{%
\tikz[remember picture with id=#2] {#1;}}
\makeatother
% end of Andrew's code

\newcommand\ShadeCell[4][0pt]{%
  \begin{tikzpicture}[overlay,remember picture]%
    \shade[#4] ( $ (pic cs:#2) + (0pt,1.9ex) $ ) rectangle ( $ (pic cs:#3) + (0pt,-#1*\baselineskip-.8ex) $ );
  \end{tikzpicture}%
}%

\newcommand\HatchedCell[4][0pt]{%
  \begin{tikzpicture}[overlay,remember picture]%
    \fill[#4] ( $ (pic cs:#2) + (0,1.9ex) $ ) rectangle ( $ (pic cs:#3) + (0pt,-#1*\baselineskip-.8ex) $ );
  \end{tikzpicture}%
}%


\begin{document}

  \HatchedCell{start1}{end1}{%
  pattern color=black!70,pattern=north east lines}
\HatchedCell{start2}{end2}{%
  pattern color=black!70,pattern=north west lines}
\HatchedCell{start3}{end3}{%
  pattern color=black!70,pattern=north east lines}
\HatchedCell{start4}{end4}{%
  pattern color=black!70,pattern=north west lines}
\HatchedCell{start5}{end5}{%
  pattern color=black!70,pattern=north east lines}
\HatchedCell{start6}{end6}{%
  pattern color=black!70,pattern=north west lines}

\newcommand*{\hatch}[2]{\multicolumn{#2}{!{\hspace*{-0.4pt}\tikzmark{start#1}}c!{\tikzmark{end#1}}}{}}

Testing table positioning:

\begin{table}
  \centering
  \rowcolors{2}{gray!10}{white}
\noindent\begin{tabular}{lrrrrrrrr}
\toprule
    Activity & \multicolumn{8}{c}{month range} \\
     & \scriptsize{0--6} & \scriptsize{7--12} & \scriptsize{12--18} & \scriptsize{19--24} & \scriptsize{25-30} & \scriptsize{31-36} & \scriptsize{37--42} & \scriptsize{42--48} \\
    \toprule
   row 1 & \hatch{1}{2} & & & & & & \\
   row 2  & & \hatch{2}{2}  & \\
   row 3  & & \hatch{3}{3} & & & &  \\
   row 4  & & \hatch{4}{6} \\
   row 5  & & & &  & &\hatch{5}{3} \\
   row 6 & \hatch{6}{8}  \\
    \bottomrule
    \rowcolor{white}
    \textsc{Milestones}  &  & & \multicolumn{1}{r|}{\rom{1}$\rightarrow$}& &  \multicolumn{1}{r|}{\rom{2}$ \rightarrow$}&&&\\
\end{tabular}
\label{tab:work_plan}

\end{table}


\end{document}
答案1
首先,正如 percusse 所说,您不需要那页长的初始代码,而是加载\usetikzlibrary{tikzmark}。其次,应该按照 Paul Gaborit 和环境内部所述\HatchedCell进行。此外,我已经使用了您没有告诉的。另外,请注意我在代码中所做的一些注释。tabulartable\newcommand{\rom}{}
以下是完善的代码
\documentclass[10pt,a4paper]{article}
\usepackage[usenames,dvipsnames,svgnames,table]{xcolor} % use color
\usepackage{booktabs} % commands for table rules
\usepackage{tikz}
\usetikzlibrary{calc,shadings,patterns,tikzmark}

\newcommand\ShadeCell[4][0pt]{%
  \begin{tikzpicture}[overlay,remember picture]%
    \shade[#4] ( $ (pic cs:#2) + (0pt,1.9ex) $ ) rectangle ( $ (pic cs:#3) + (0pt,-#1*\baselineskip-.8ex) $ );
  \end{tikzpicture}%
}%

\newcommand\HatchedCell[4][0pt]{%
  \begin{tikzpicture}[overlay,remember picture]%
    \fill[#4] ( $ (pic cs:#2) + (0,1.9ex) $ ) rectangle ( $ (pic cs:#3) + (0pt,-#1*\baselineskip-.8ex) $ );
  \end{tikzpicture}%
}%

\newcommand*{\hatch}[2]{\multicolumn{#2}{!{\hspace*{-0.4pt}\tikzmark{start#1}}c!{\tikzmark{end#1}}}{}}
\newcommand{\rom}{}
\begin{document}


Testing table positioning:

\begin{table}[htb]  %% better use [htb]
  \centering
  \rowcolors{2}{gray!10}{white}
\begin{tabular}{lrrrrrrrr}        %% \noindent not needed here
\toprule
    Activity & \multicolumn{8}{c}{month range} \\
     & \scriptsize{0--6} & \scriptsize{7--12} & \scriptsize{12--18} & \scriptsize{19--24} & \scriptsize{25-30} & \scriptsize{31-36} & \scriptsize{37--42} & \scriptsize{42--48} \\
    \toprule
   row 1 & \hatch{1}{2} & & & & & & \\
   row 2  & & \hatch{2}{2}  & \\
   row 3  & & \hatch{3}{3} & & & &  \\
   row 4  & & \hatch{4}{6} \\
   row 5  & & & &  & &\hatch{5}{3} \\
   row 6 & \hatch{6}{8}  \\
    \bottomrule
    \rowcolor{white}
    \textsc{Milestones}  &  & & \multicolumn{1}{r|}{\rom{1}$\rightarrow$}& &  \multicolumn{1}{r|}{\rom{2}$ \rightarrow$}&&&\\
\end{tabular}
%\label{tab:work_plan}         %% \label without a \caption is useless
%
\HatchedCell{start1}{end1}{%
  pattern color=black!70,pattern=north east lines}
\HatchedCell{start2}{end2}{%
  pattern color=black!70,pattern=north west lines}
\HatchedCell{start3}{end3}{%
  pattern color=black!70,pattern=north east lines}
\HatchedCell{start4}{end4}{%
  pattern color=black!70,pattern=north west lines}
\HatchedCell{start5}{end5}{%
  pattern color=black!70,pattern=north east lines}
\HatchedCell{start6}{end6}{%
  pattern color=black!70,pattern=north west lines}
%
\end{table}
\end{document}

可以使用类似这样的循环\HatchedCell来减少多行\foreach
\foreach \x/\y  in {1/1,3/3,5/5}{
\HatchedCell{start\x}{end\y}{%
  pattern color=black!70,pattern=north east lines}
}
\foreach \x/\y  in {2/2,4/4,6/6}{
\HatchedCell{start\x}{end\y}{%
  pattern color=black!70,pattern=north west lines}
}
%
答案2
{NiceTabular}供参考,这里有一种使用nicematrix(2022-08-24 的 ≥ 6.13)构建该表的方法。
\documentclass[10pt,a4paper]{article}
\usepackage{xcolor}
\usepackage{booktabs} % commands for table rules
\usepackage{nicematrix}
\usepackage{tikz}
\usetikzlibrary{patterns}

\begin{document}

\tikzset
  {
    style a/.style = {pattern = north east lines, pattern color=black!70} ,
    style b/.style = {pattern = north west lines, pattern color=black!70}
  }


\begin{table}[htb]
\centering
\begin{NiceTabular}{lrrrrrrrr}
\CodeBefore
    \rowcolors{3-8}{gray!10}{}
\Body
    \toprule
        Activity & \Block{1-8}{month range} \\
    \RowStyle{\scriptsize}
         & 0--6 & 7--12 & 12--18 & 19--24 & 25-30 & 31-36 & 37--42 & 42--48 \\
    \midrule
       row 1 & \Block[tikz = style a]{1-2}{} \\
       row 2 & & \Block[tikz = style b]{1-2}{} \\
       row 3 & & \Block[tikz = style a]{1-3}{} \\
       row 4 & & \Block[tikz = style b]{1-6}{} \\
       row 5 & & & & & \Block[tikz = style a]{1-2}{} \\
       row 6 & \Block[tikz = style b]{1-*}{} \\
    \bottomrule
       \textsc{Milestones} & & & \Block[r,borders=right]{}{1$\to$}
                             & & \Block[r,borders=right]{}{2$\to$}\\
\end{NiceTabular}
\end{table}

\end{document}
您需要多次编译(因为 PGF/Tikz 节点)。
