

这是pgfplot dateplot 轴上的离散日期,由 Peter Grill 回答。绘制离散日期的解决方案是仅使用唯一日期。
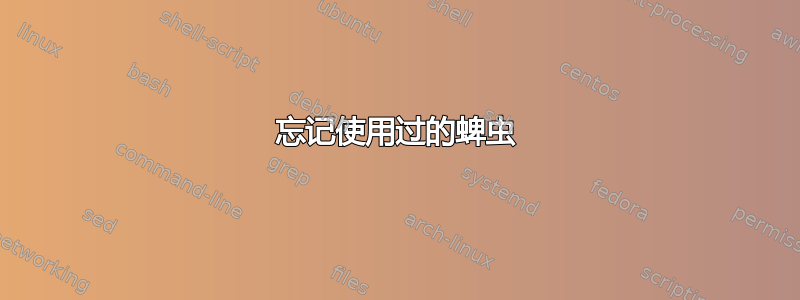
但是,在制作两个轴上有对应日期的图时,日期是已知的,因此不会在第二个图中绘制(见图)。有没有办法在第一个图之后忘记“使用的刻度”?(我尝试使用:取消定义宏\tick,\let\tick=\undefined但这不起作用)。
\documentclass{standalone}
\usepackage{pgfplots}
\usepackage{etoolbox}
\usepgfplotslibrary{dateplot}
\pgfplotsset{compat=1.12}
\usepackage{filecontents}

\begin{filecontents*}{data.csv}
    date,value
    2015-01-01, 3.2
    2015-01-02, 6.5
    2015-01-04, 6.8
\end{filecontents*}
\begin{document}
    \begin{tikzpicture}
    \centering
    \begin{axis}[
    date coordinates in=x,
    xticklabel={\day-\month-\year},
    x tick label style={rotate=45,anchor=north east},
    date ZERO=2015-01-01,
    grid=both,
    enlarge x limits=false,
    xlabel={Date (day-month-year)},
    ylabel={Value},
    xticklabel={%
        \ifcsdef{Tick Used \tick}{}{%
            \tick%
            \csxdef{Tick Used \tick}{}%
        }%
    },
    ]
    \addplot table [x=date, y=value, col sep=comma] {data.csv};
    \end{axis}
    \end{tikzpicture}
\end{document}

答案1
如果您不想使用唯一名称,可以采用以下解决方案:如何保存字符串的运行列表,然后逐个处理它们并列出undef需要完成的任务。因此,
\csxdef{Tick Used \tick}{}%
你改用
\MarkTickAsUsed{Tick Used \tick}%
将以下内容添加到序言中将会在每次开始时清除此列表tikzpicture:
\newcommand\ClearTickList{}
\newcommand\MarkTickAsUsed[1]{%
    \xdef\ClearTickList{\ClearTickList\csundef{#1}\endgraf}% Store tick so that we can clear it later
    \csxdef{Tick Used \tick}{}%
}
\AtBeginEnvironment{tikzpicture}{\ClearTickList}

代码:
\documentclass[border=2pt]{standalone}
\usepackage{pgfplots}
\usepackage{etoolbox}
\usepgfplotslibrary{dateplot}
\pgfplotsset{compat=1.12}
\usepackage{filecontents}

%% https://tex.stackexchange.com/questions/14393/how-keep-a-running-list-of-strings-and-then-process-them-one-at-a-time
\newcommand\ClearTickList{}
\newcommand\MarkTickAsUsed[1]{%
    \xdef\ClearTickList{\ClearTickList\csundef{#1}\endgraf}% Store tick so that we can clear it later
    \csxdef{Tick Used \tick}{}%
}
\AtBeginEnvironment{tikzpicture}{\ClearTickList}


\begin{filecontents*}{data.csv}
    date,value
    2015-01-01, 3.2
    2015-01-02, 6.5
    2015-01-04, 6.8
\end{filecontents*}
\begin{document}
    \begin{tikzpicture}
    \centering
    \begin{axis}[
    date coordinates in=x,
    xticklabel={\day-\month-\year},
    x tick label style={rotate=45,anchor=north east},
    date ZERO=2015-01-01,
    grid=both,
    enlarge x limits=false,
    xlabel={Date (day-month-year)},
    ylabel={Value},
    xticklabel={%
        \ifcsdef{Tick Used \tick}{}{%
            \tick%
            \MarkTickAsUsed{Tick Used \tick}%
        }%
    },
    ]
    \addplot table [x=date, y=value, col sep=comma] {data.csv};
    \end{axis}
    \end{tikzpicture}
    \begin{tikzpicture}
    \centering
    \begin{axis}[
    date coordinates in=x,
    xticklabel={\day-\month-\year},
    x tick label style={rotate=45,anchor=north east},
    date ZERO=2015-01-01,
    grid=both,
    enlarge x limits=false,
    xlabel={Date (day-month-year)},
    ylabel={Value},
    xticklabel={%
        \ifcsdef{Tick Used \tick}{}{%
            \tick%
            \csxdef{Tick Used \tick}%
        }%
    },
    ]
    \addplot table [x=date, y=value, col sep=comma] {data.csv};
    \end{axis}
    \end{tikzpicture}
\end{document}