

index.dat我有一个包含数据的csv 文件
Year,0-19 years,20-39 years,40-59 years,60-79 years,80-99 years,100 years+
2000,100,100,100,100,100,100
2001,101,102,101,102,101,102
...
我正在尝试用 来绘制这个图表pgfplots。
我已经制作了这个脚本
\begin{tikzpicture}

\begin{axis}[
    width=\textwidth,
    height=0.5\textwidth,
    grid=both,
    xmin=2000,
    xmax=2010,
    xticklabel style={/pgf/number format/1000 sep=, rotate=45},
    ymin=80,
]

\addplot table [x=Year, y=0-19 years, col sep=comma] {./data/index.dat};
\addlegendentry{0-19 years}

\addplot table [x=Year, y=20-39 years, col sep=comma] {./data/index.dat};
\addlegendentry{20-39 years}

\addplot table [x=Year, y=40-59 years, col sep=comma] {./data/index.dat};
\addlegendentry{40-59 years}

\addplot table [x=Year, y=60-79 years, col sep=comma] {./data/index.dat};
\addlegendentry{60-79 years}

\addplot table [x=Year, y=80-99 years, col sep=comma] {./data/index.dat};
\addlegendentry{80-99 years}

\addplot table [x=Year, y=100 years+, col sep=comma] {./data/index.dat};
\addlegendentry{100 years+}

\end{axis}

\end{tikzpicture}
而且它运行良好,但我认为这是一个有点愚蠢的做法。
我可以通过指定我想要绘制从 2 到 7 的所有列并使用第 1 列作为 x 值来执行相同操作吗?
答案1
简单循环
首先,我会使用\pgfplotstableread宏将表格读入一次,然后重复使用这个宏。这样可以加快排版速度,并且在文件的位置、名称或格式发生变化时节省一些打字时间。
\pgfplotstableread[col sep=comma]{index.dat}\loadedtable
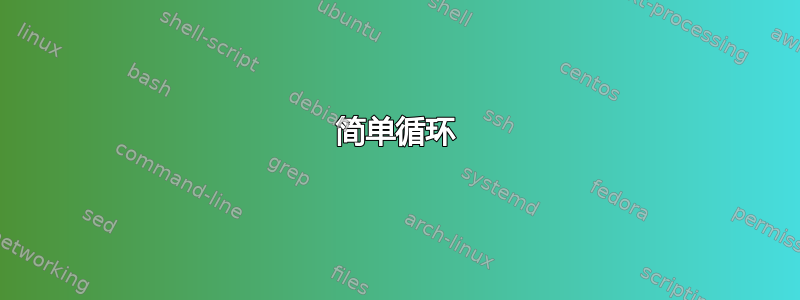
由于您对每一列执行的操作完全相同,即绘制并将列名添加到图例中,因此我建议循环遍历所有列。
\pgfplotsinvokeforeach{0-19 years,20-39 years,40-59 years,60-79 years,80-99 years,100 years+}{
  \addplot table [x=Year, y=#1, col sep=comma] {\loadedtable};
  \addlegendentry{#1}
}
注意!您必须在此处使用 或\pgfplotsungroupedforeach。\pgfplotsinvokeforeach经典的 TikZ\foreach将不是直截了当地工作。
您仅提供了前两个数据样本,这就是为什么输出看起来有点荒谬。
\documentclass{article}
\begin{filecontents*}{index.dat}
Year,0-19 years,20-39 years,40-59 years,60-79 years,80-99 years,100 years+
2000,100,100,100,100,100,100
2001,101,102,101,102,101,102
\end{filecontents*}
\usepackage{pgfplots}
\begin{document}
\begin{tikzpicture}
  \begin{axis}[
    width=\textwidth,
    height=0.5\textwidth,
    grid=both,
    xmin=2000,
    xmax=2010,
    xticklabel style={/pgf/number format/1000 sep=, rotate=45},
    ymin=80,
    ]
    \pgfplotstableread[col sep=comma]{index.dat}\loadedtable
    \pgfplotsinvokeforeach{0-19 years,20-39 years,40-59 years,60-79 years,80-99 years,100 years+}{
      \addplot table [x=Year, y=#1] {\loadedtable};
      \addlegendentry{#1}
    }
  \end{axis}
\end{tikzpicture}
\end{document}

多个循环变量
如果您还想为循环中的图指定某种样式(颜色、标记等),则必须使用\foreach,因为\pgfplotsinvokeforeach只允许一个变量。缺点是与相比\pgfplotsinvokeforeach,其中#1只是被取代通过循环变量的内容,因为\foreach您必须在上下文中显式地扩展循环变量(这就是我上面提到的\edef陷阱)。因此,循环转换为\foreach
\foreach \col/\style in {%
  0-19 years/{red,dashed,mark options={red}},
  20-39 years/{blue},
  40-59 years/{green},
  60-79 years/{yellow},
  80-99 years/{magenta},
  100 years+/{cyan}
} {
  \edef\temp{%
    \noexpand\addplot+[\style] table [x=Year, y=\col] {\noexpand\loadedtable};
    \noexpand\addlegendentry{\col}
  }
  \temp
}
完整的例子如下
\documentclass{article}
\begin{filecontents*}{index.dat}
Year,0-19 years,20-39 years,40-59 years,60-79 years,80-99 years,100 years+
2000,100,100,100,100,100,100
2001,101,102,101,102,101,102
\end{filecontents*}
\usepackage{pgfplots}
\begin{document}
\begin{tikzpicture}
  \begin{axis}[
    width=\textwidth,
    height=0.5\textwidth,
    grid=both,
    xmin=2000,
    xmax=2010,
    xticklabel style={/pgf/number format/1000 sep=, rotate=45},
    ymin=80,
    ]
    \pgfplotstableread[col sep=comma]{index.dat}\loadedtable
    \foreach \col/\style in {%
      0-19 years/{red,dashed,mark options={red}},
      20-39 years/{blue},
      40-59 years/{green},
      60-79 years/{yellow},
      80-99 years/{magenta},
      100 years+/{cyan}
    } {
      \edef\temp{%
        \noexpand\addplot+[\style] table [x=Year, y=\col] {\noexpand\loadedtable};
        \noexpand\addlegendentry{\col}
      }
      \temp
    }
  \end{axis}
\end{tikzpicture}
\end{document}

循环列表
另一个可行的替代方案(我赞成)是创建颜色的自定义循环列表。在循环列表中,pgfplots当列表到达末尾时,在每个图上自动选择下一个条目并重复。要定义循环列表,请使用
\pgfplotscreateplotcyclelist{custom}{%
  red,mark=*\\blue,mark=square*\\green,mark=otimes*\\%
  yellow,mark=star\\magenta,mark=diamond*\\cyan,mark=*\\%
}
循环列表中的条目由 分隔。使用\\隐藏后面的换行符很重要。在条目中,您可以指定颜色、标记和其他选项,例如线条样式。在此示例中,我使用了颜色和标记。定义循环列表后(在环境之前),您必须通过添加到选项来告诉实际使用它。\\%axisaxiscycle list name=custom
\documentclass{article}
\begin{filecontents*}{index.dat}
Year,0-19 years,20-39 years,40-59 years,60-79 years,80-99 years,100 years+
2000,100,100,100,100,100,100
2001,101,102,101,102,101,102
\end{filecontents*}
\usepackage{pgfplots}
\begin{document}
\begin{tikzpicture}
  \pgfplotscreateplotcyclelist{custom}{%
    red,mark=*\\blue,mark=square*\\green,mark=otimes*\\%
    yellow,mark=star\\magenta,mark=diamond*\\cyan,mark=*\\%
  }
  \begin{axis}[
    width=\textwidth,
    height=0.5\textwidth,
    grid=both,
    xmin=2000,
    xmax=2010,
    xticklabel style={/pgf/number format/1000 sep=, rotate=45},
    ymin=80,
    cycle list name=custom
    ]
    \pgfplotstableread[col sep=comma]{index.dat}\loadedtable
    \pgfplotsinvokeforeach{0-19 years,20-39 years,40-59 years,60-79 years,80-99 years,100 years+}{
      \addplot table [x=Year, y=#1] {\loadedtable};
      \addlegendentry{#1}
    }
  \end{axis}
\end{tikzpicture}
\end{document}
