

我想构建一个包含 5 个子图的图形。我的代码如下:
\begin{figure}[hbt]
\begin{subfigure}{0.4\textwidth}
\includegraphics[scale=0.25]{mi1}
\footnotesize{\caption{masa=$(0,0203 \pm 0,0001)\;kg$, $m=(2,43\pm 0,01)\; s^{-2}$, $b= (1,22 \pm 0,08)\; s^{-1}$, $R^2=0,990$. }}
\end{subfigure}
\begin{subfigure}{0.4\textwidth}
\includegraphics[scale=0.25]{mi2}
\footnotesize{\caption{masa=$(0,0401 \pm 0,0001)\;kg$, $m=(5,20\pm 0,03)\; s^{-2}$, $b= (3,6 \pm0,1)\; s^{-1}$, $R^2=0,990$.}}
\end{subfigure}
\begin{subfigure}{0.4\textwidth}
\includegraphics[scale=0.25]{mi3}
\footnotesize{\caption{masa=$(0,0503 \pm 0,0001)\;kg$, $m=(6,44\pm0,04)\; s^{-2}$, $b= (8,7 \pm0,1)\; s^{-1}$, $R^2=0,987$.}}
\end{subfigure}
\begin{subfigure}{0.4\textwidth}
\includegraphics[scale=0.25]{mi4}
\footnotesize{\caption{masa=$(0,0704 \pm 0,0001)\;kg$, $m=(9,32\pm0,05)\; s^{-2}$, $b= (11,9 \pm0,1)\; s^{-1}$, $R^2=0,987$.}}
\end{subfigure}
\begin{subfigure}{\textwidth}
\centering
\includegraphics[scale=0.25]{mi5}
\footnotesize{\caption{masa=$(0,0904 \pm 0,0001)\;kg$, \\ $m=(12,14\pm0,08)\; s^{-2}$, $b= (8,8 \pm \\ 0,2)\; s^{-1}$, $R^2=0,987$.}}
\end{subfigure}
\caption{Se representan las velocidades angulares que adquiere la placa cebra en función del tiempo cuando el sistema se encuentra acelerado angularmente por una masa variable que ejerce un torque a una distancia de $(0,01998 \pm 0,00001) \;m$  con respecto al centro de masa. En rojo se superpone la recta de regresión calculada por el método de cuadrados mínimos con su pendiente $m$.}
\end{figure}
问题出在最后一个子图上。我想把它放在中间,但如果我使用 \linewidth,子图的标题将从页面的开头开始,而不是子图的实际位置。
有人可以帮忙解决这个问题吗?
答案1
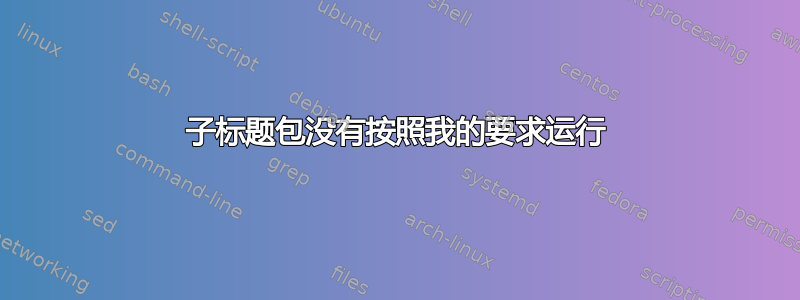
不要将最后一个的宽度设置subfigure为\textwidth,而是也将其设置为0.4\textwidth,\centering在 的开头添加figure,并且可能\hfill在同一行上的子图之间添加 。
其他一些评论:
\footnotesize不是接受参数的宏,因此要限制其效果,您应使用{\footnotsize ...\par},而不是\footnotesize{..}。但是,您不应像以前一样对每个子标题都使用它,要更改子标题的字体属性,请使用\captionsetup,如以下代码所示。单位应该用直立字体书写,而不是默认的数学字体,因此
$m$例如 是错误的。一个非常好的用于排版数字和单位(或只是数字,或只是单位)的软件包是siunitx。我修改了您的标题以在下面使用它。
\documentclass{article}
\usepackage{graphicx}
\usepackage{amsmath}
\usepackage{subcaption}
\captionsetup[subfigure]{font=footnotesize,justification=raggedright}
\usepackage{siunitx}
\sisetup{
  output-decimal-marker={,},
  separate-uncertainty=true
}
\begin{document}

\begin{figure}[hbt]
\centering
\begin{subfigure}{0.45\textwidth}
\centering
\includegraphics[width=\linewidth]{example-image}
\caption{%
$\text{masa}=\SI{0,0203 \pm 0,0001}{\kg}$, $m=\SI{2,43\pm 0,01}{\per\square\s}$, $b= \SI{1,22 \pm 0,08}{\per\s}$, $R^2=\num{0,990}$. }
\end{subfigure}\hfill
\begin{subfigure}{0.45\textwidth}
\centering
\includegraphics[width=\linewidth]{example-image}
\caption{$\text{masa}=\SI{0,0401 \pm 0,0001}{\kg}$, $m=\SI{5,20\pm 0,03}{\per\square\s}$, $b= \SI{3,6 \pm0,1}{\per\s}$, $R^2=\num{0,990}$.}
\end{subfigure}

\begin{subfigure}{0.45\textwidth}
\centering
\includegraphics[width=\linewidth]{example-image}
\caption{$\text{masa}=\SI{0,0503 \pm 0,0001}{\kg}$, $m=\SI{6,44\pm0,04}{\per\second\squared}$, $b= \SI{8,7 \pm0,1}{\per\s}$, $R^2=\num{0,987}$.}
\end{subfigure}\hfill
\begin{subfigure}{0.45\textwidth}
\centering
\includegraphics[width=\linewidth]{example-image}
\caption{$\text{masa}=\SI{0,0704 \pm 0,0001}{\kg}$, $m=\SI{9,32\pm0,05}{\per\square\s}$, $b= \SI{11,9 \pm0,1}{\per\s}$, $R^2=\num{0,987}$.}
\end{subfigure}

\begin{subfigure}{0.45\textwidth}
\centering
\includegraphics[width=\linewidth]{example-image}
\caption{$\text{masa}=\SI{0,0904 \pm 0,0001}{\kg}$,  $m=\SI{12,14\pm0,08}{\per\square\s}$, $b= \SI{8,8 \pm 0,2}{\per\s}$, $R^2=\num{0,987}$.}
\end{subfigure}
\caption{Se representan las velocidades angulares que adquiere la placa cebra en función del tiempo cuando el sistema se encuentra acelerado angularmente por una masa variable que ejerce un torque a una distancia de \SI{0,01998 \pm 0,00001}{\m}  con respecto al centro de masa. En rojo se superpone la recta de regresión calculada por el método de cuadrados mínimos con su pendiente \si{m}.}
\end{figure}
\end{document}
