

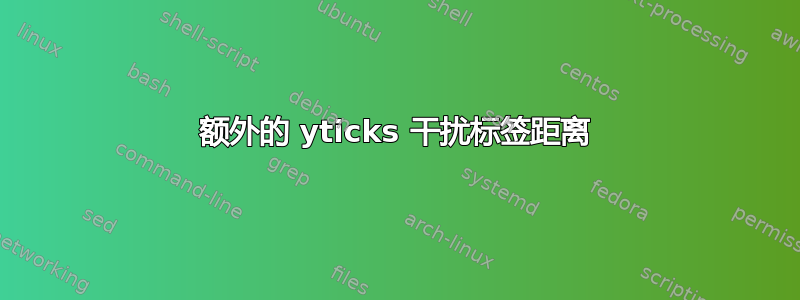
我有一系列具有类似格式的图表,但我发现一些标签的位置离轴数字太远,如下面的屏幕截图所示。

以下代码重现了该问题。如果您注释掉该extra y ticks行,问题就会得到解决,这表明这些代码以某种方式干扰了用于确定标签正确位置的计算。
如何让所有标签与轴的距离相同?无论是否存在额外的刻度,它们都应该看起来像右侧的图像。
\documentclass{article}
\usepackage{tikz}
\usepackage{pgfplots}
\begin{document}

\begin{figure}[tp]
    \centering
    \begin{tikzpicture}
    \begin{axis}[
    xlabel={Absorption Energy ($cm^{-1}$)},
    ylabel={Fluorescence Energy ($cm^{-1}$)},
    xtick distance=5,ytick distance=10,minor y tick num=9,
    extra y ticks={37425,37435,37445,37455,37465,37475,37485,37495,37505,37515,37525},
    extra tick style={major tick length=0.15cm, xticklabels={}, yticklabels={}},
    width=12.5cm,height=9.45817cm,
    scale only axis=true,font=\footnotesize,enlargelimits=false,axis on top,xtick pos=left,ytick pos=left,tick align=outside,major tick length=0.2cm,tick style={black},scaled ticks=false,/pgf/number format/.cd,  1000 sep={\thinspace},
    every axis y label/.style={at={(ticklabel cs:0.5)},rotate=90,anchor=near ticklabel},
    every axis x label/.style={at={(ticklabel cs:0.5)},anchor=near ticklabel},
    ]

    \addplot graphics[xmin=37537.2353, xmax=37566.88252, ymin=37424.51271, ymax=37526.87033, includegraphics={keepaspectratio}] {example-image};

    \end{axis}
    \end{tikzpicture}
    \caption{text}
\end{figure}

\end{document}
答案1
tick align=outside这确实是与结合导致的一个错误extra ticks。 那里major tick length被认为是“多出两倍”。 第一次是正常的major tick length,第二次是major tick length的extra y ticks。
请查看代码中的注释以了解更多详细信息以及如何防止/撤消额外的移位。(蓝色部分表示“您的结果”和额外的转变,黑色表示“正确”的ylabel定位。)
(我向PGFPlots 追踪器。
% used PGFPlots v1.14
\documentclass[border=5pt]{standalone}
\usepackage{pgfplots}
    % use this `compat' level or higher to use the advanced positioning of the
    % axis labels
    \pgfplotsset{compat=1.3}
\begin{document}
\begin{tikzpicture}
        % give the tick length as variables, to be able to calculate a bit
        % in the `axis' options, where you cannot call them with
        %`\pgfkeysvalueof', because they are not evaluated there at this
        % point in time
        \pgfmathsetlengthmacro{\MajorTickLength}{0.20cm}
        \pgfmathsetlengthmacro{\ExtraMajorTickLength}{0.15cm}
%        % ---------------------------------------------------------------------
%        % for debugging purposes I enlarged the tick length and have drawn
%        % a point on the left, so that there is no shift in the plot when
%        % changing the values (in certain limits)
%        \pgfmathsetlengthmacro{\MajorTickLength}{10mm}
%        \pgfmathsetlengthmacro{\ExtraMajorTickLength}{5mm}
%        \fill (-5,0) circle (2pt);
%        % ---------------------------------------------------------------------
    \begin{axis}[
        footnotesize,
        width=12.5cm,
        height=9.45817cm,
        xlabel={Absorption Energy ($\mathrm{cm}^{-1}$)},
        ylabel={Fluorescence Energy ($\mathrm{cm}^{-1}$)},
        % ---------------------------------------------------------------------
        % this gives you the "correct" ylabel positioning
        % (to see that this is really the "right" position, comment the
        %  `ylabel style' and the `extra y ticks' line. Watch the updating
        %  PDF where you will not see a jump of the ylabel.)
        ylabel style={
            yshift=-\MajorTickLength - \ExtraMajorTickLength,
        },
        % ---------------------------------------------------------------------
        extra y ticks={37425,37435,37445,37455,37465,37475,37485,37495,37505,37515,37525},
        extra tick style={
            major tick length=\ExtraMajorTickLength,   % <-- (this adds a shift as well)
            xticklabels={},
            yticklabels={},
        },
        xtick distance=5,
        ytick distance=10,
        minor y tick num=9,
        scale only axis=true,
        enlargelimits=false,
        axis on top,
        xtick pos=left,
        ytick pos=left,
        tick align=outside,         % <-- this causes the shift
        major tick length=\MajorTickLength,
        tick style={black},
        scaled ticks=false,
        ticklabel style={
            /pgf/number format/.cd,
                1000 sep={\thinspace},
        },
        % ---------------------------------------------------------------------
        % for debugging purposes only to be able to see TikZ stuff outside
        % the plot area
        clip mode=individual,
        % ---------------------------------------------------------------------
    ]
        \addplot graphics [
            xmin=37537.2353,
            xmax=37566.88252,
            ymin=37424.51271,
            ymax=37526.87033,
%            % (to fully fill the plot area don't use `keepaspectratio')
%            includegraphics={keepaspectratio}
        ] {example-image};

        % ---------------------------------------------------------------------
        % for debugging purposes only to find out, what is happening with
        % the ylabel positioning
            \pgfmathsetlengthmacro{\xshift}{
                % offset when ticks are inside (roughly estimated)
                -7ex
                % additional offset when ticks are outside
                - \pgfkeysvalueof{/pgfplots/major tick length}
                % additional offset of extra ticks
                - (\pgfkeysvalueof{/pgfplots/major tick length} + \ExtraMajorTickLength)
            }
        \node [rotate=90,anchor=south,text=blue,font=\small]
            (dot) at ([xshift=\xshift]rel axis cs:0,0.5)
                {Fluorescence Energy ($\mathrm{cm}^{-1})$};
        % ---------------------------------------------------------------------
    \end{axis}
\end{tikzpicture}
\end{document}
