

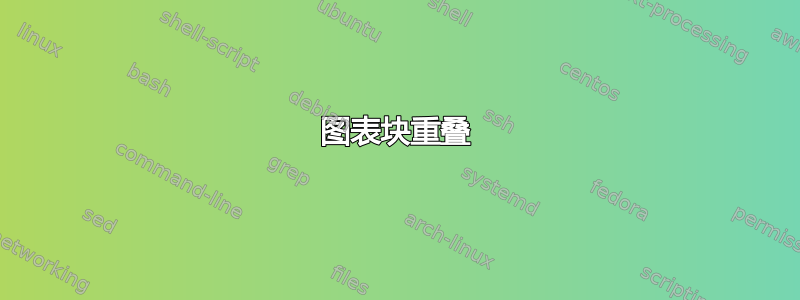
我正在尝试将我之前在 R 中创建的图表添加到 beamer 演示文稿中,即:
我相信最好的选择是采用 Tkiz 包,但我很难让它发挥作用。
我可以毫无问题地重新创建块的样式:例如,对于我使用的蓝色块
\tikzstyle{decision} = [diamond, draw, fill=blue!20,
text width=3.5em, text badly centered, node distance=.5cm, inner sep=0pt]
right of = xxx并且运行完美。我失败的地方是无法正确定位块。无论我使用(定位选项)还是 ,它们都会相互重叠right = of xxx。
很抱歉,但这是我第一次使用 Tkiz,我有点迷茫。
感谢您的帮助!
\tikzstyle{decision} = [diamond, draw, fill=blue!20,
    text width=4.5em, text badly centered, node distance=.5cm, inner sep=0pt]
\tikzstyle{block} = [rectangle, draw,
    text width=5em, text centered, rounded corners, minimum height=4em]
\tikzstyle{line} = [draw, -latex']

\begin{tikzpicture}[node distance = .5cm, auto]
    % blocks
   \node [decision] (LR) {Literature Reviews};
   \node [block, right = of LR] (NR) {Narrative Reviews};
   \node [decision, right = of LR] (SR) {Systematic Review};
   \node [block, right = of SR] (VC) {Vote Counting};
   \node [decision, right = of SR] (MA) {Meta-Analysis};
   \node [block, right = of SR] (O) {Others};
   \node [block, right = of VC] (IVC) {Informal Vote Counting};
   \node [block, right = of VC] (FVC) {Formal Vote Counting};
   \node [block, right = of MA] (PB) {Publication Bias};
   \node [block, right = of MA] (MO) {Moderator Analysis};
   \node [block, right = of MO] (MRA) {Meta-Regression};
   \node [block, right = of MO] (CM) {Categorical Models};
   \node [block, right = of MO] (CT) {Clustering Techniques};
    % lines
    \path [line] (LR) -- (NR);
    \path [line] (LR) -- (SR);
    \path [line] (SR) -- (VC);
    \path [line] (SR) -- (MA);
    \path [line] (SR) -- (O);
    \path [line] (VC) -- (IVC);
    \path [line] (VC) -- (FVC);
    \path [line] (MA) -- (PB);
    \path [line] (MA) -- (MO);
    \path [line] (MO) -- (MRA);
    \path [line] (MO) -- (CM);
    \path [line] (MO) -- (CT);

\end{tikzpicture}
马可
答案1
例如,假设您放置了三个不同的节点right=of SR。换句话说,这三个节点位于完全相同的位置。在适当的位置使用above right或。您可以通过添加和(例如)below right来微调位置。xshiftyshiftxshift=3mm

\documentclass{article}
\usepackage{tikz}
\usetikzlibrary{shapes,positioning,arrows}
\tikzset{
 decision/.style={diamond, draw, fill=blue!20,
    text width=4.5em, text badly centered, inner sep=0pt},
 block/.style={rectangle, draw,
    text width=5em, text centered, rounded corners, minimum height=4em},
 line/.style={draw, -latex'}
}

\begin{document}
\begin{tikzpicture}[node distance = .6cm and .6cm, auto]
    % blocks
   \node [decision] (LR) {Literature Reviews};
   \node [block, above right = of LR] (NR) {Narrative Reviews};
   \node [decision,below right = of LR] (SR) {Systematic Review};
   \node [block, above right = of SR] (VC) {Vote Counting};
   \node [decision, right = of SR] (MA) {Meta-Analysis};
   \node [block, below right = of SR] (O) {Others};
   \node [block, above right = of VC] (IVC) {Informal Vote Counting};
   \node [block, right = of VC] (FVC) {Formal Vote Counting};
   \node [block, below right = of MA] (PB) {Publication Bias};
   \node [block, right = of MA] (MO) {Moderator Analysis};
   \node [block, above right = of MO] (MRA) {Meta-Regression};
   \node [block, right = of MO] (CM) {Categorical Models};
   \node [block, below right = of MO] (CT) {Clustering Techniques};
    % lines
    \path [line] (LR) -- (NR);
    \path [line] (LR) -- (SR);
    \path [line] (SR) -- (VC);
    \path [line] (SR) -- (MA);
    \path [line] (SR) -- (O);
    \path [line] (VC) -- (IVC);
    \path [line] (VC) -- (FVC);
    \path [line] (MA) -- (PB);
    \path [line] (MA) -- (MO);
    \path [line] (MO) -- (MRA);
    \path [line] (MO) -- (CM);
    \path [line] (MO) -- (CT);
\end{tikzpicture}
\end{document}