

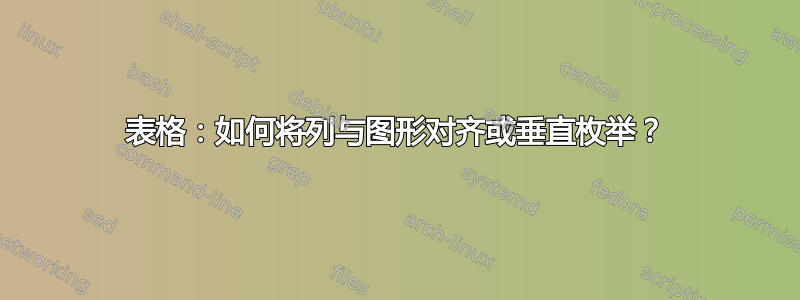
对于我的论文,我需要一个两列布局,第一列是标签,第二列是文本、表格和图形。目前我使用的环境tabular如下。
如何将“Implementation:”垂直对齐到“* ITEM1”,将“Tabular:”垂直对齐到“A|B”,并将“Diagram:”垂直对齐到图纸的顶部?
也许有比使用更好的解决方案tabular?
欢迎任何提示或建议!
\documentclass{article}
\usepackage[utf8]{inputenc}
\usepackage{tikz}
    \usetikzlibrary{calc,arrows.meta,positioning,decorations.pathreplacing,decorations.markings}

\begin{document}

\begin{table}[!htbp]
  \centering
  \begin{tabular}[t]{ll}
\textbf{ADD A,B,C}                & \textbf{Add A and B and store result in C}     \\
                                  &                                                \\
Addressingmodes:                  & A~~absolut                                     \\
                                  & C~~absolut                                     \\
                                  &                                                \\
Description:                     & $C=A+B$                                         \\
                                  & \begin{minipage}{0.7\textwidth}
                                    Add A and B ...
                                    \end{minipage}                                 \\
                                  &                                                \\
Implementation:                   & \begin{minipage}{0.7\textwidth}
                                      \begin{itemize}
                                          \item ITEM1
                                          \item ITEM2
                                      \end{itemize}
                                    \end{minipage}                                  \\
                                  &                                                 \\
Tabular:                          & \begin{minipage}{.7\textwidth}
                                        \begin{tabular}[t]{c|c}
                                            A & B \\
                                            C & D
                                        \end{tabular}
                                    \end{minipage}                                  \\
Diagram:                          & \begin{minipage}{.7\textwidth}
\begin{tikzpicture}[
  decoration={
markings,
mark=at position 0.5 with {\draw (3pt,2pt) -- (-3pt,-2pt);}
}]

\node (rect) at (4,2) [draw,thick,minimum width=4cm,minimum height=3cm]     {Functional~Unit};

\draw [thick,postaction={decorate}] ($(rect.north west)!0.35!(rect.south west)$) -- ++(-3,0) node[midway,below] {$Operand~A$};

\draw [thick,postaction={decorate}] ($(rect.north west)!0.65!(rect.south west)$) -- ++(-3,0) node[midway,below] {$Operand~B$};

\draw [thick,postaction={decorate}] ($(rect.north east)!0.20!(rect.south east)$) -- ++(2,0) node[midway,below] {$Result$};

\draw [thick,postaction={decorate}] ($(rect.north east)!0.50!(rect.south east)$) -- ++(2,0) node[midway,below] {$PC$};

\draw [thick,postaction={decorate}] ($(rect.north east)!0.80!(rect.south east)$) -- ++(2,0) node[midway,below] {$PSW$};

\draw [thick,postaction={decorate}] ($(rect.north west)!0.50!(rect.north east)$) -- ++(0,1) node[midway,right] {$Enable$};

\end{tikzpicture}

                                    \end{minipage}                                  \\
  \end{tabular}
\end{table}
\end{document}
答案1
希望我理解正确:

我做了以下事情:
- 使用
tabularx表格环境, - 将第一列右对齐,第二列是
X类型(使用它,minipages 是多余的), - 为了枚举我使用
enumitem包 - 为了
tikzpicture与单元格顶部对齐,我添加了选项baseline=(current bounding box.north) - 我也关注
tikzpicture代码。现在更短了:-)
\documentclass{article}
\usepackage[utf8]{inputenc}
\usepackage{tikz}
\usetikzlibrary{arrows.meta, decorations.markings, positioning}
\usepackage{makecell, tabularx}
\setcellgapes{3pt}
\usepackage{enumitem}

\begin{document}
\begin{table}[!htbp]
  \centering
  \makegapedcells
  \begin{tabularx}{\linewidth}{rX}
\textbf{ADD A,B,C}      & \textbf{Add A and B and store result in C}    \\
Addressingmodes:        & A absolut                                     \\
                        & C absolut                                     \\
Description:            & $C=A+B$                                       \\
                        &  Add A and B \dots                            \\
Implementation:         & \begin{itemize}[nosep,
                                          leftmargin=*,
                                          before=\vspace{-0.5\baselineskip},
                                           after=\vspace{-0.5\baselineskip}]
                          \item ITEM1
                          \item ITEM2
                          \end{itemize}                                 \\
Tabluar:                & \begin{tabular}[t]{c|c}
                                            A & B \\
                                            C & D
                          \end{tabular}                                 \\
Diagram:                & \begin{tikzpicture}[baseline=(current bounding box.north),
                            decoration={markings,
                            mark=at position 0.5 with {\draw (3pt,2pt) -- (-3pt,-2pt);}
                                            },
                            line/.style={thick,postaction={decorate}}
                                            ]
    \node (rect) [draw,thick,minimum width=4cm,minimum height=3cm]     {Functional Unit};
    \draw [line] ([yshift= 7mm] rect.west) -- node[below] {\textit{Operand A}} ++(-3,0);
    \draw [line] ([yshift=-7mm] rect.west) -- node[below] {\textit{Operand B}} ++(-3,0);
    \draw [line] ([yshift= 10mm] rect.east) -- node[below] {\textit{Result}} ++(2,0);
    \draw [line] (rect.east) -- node[below] {\textit{PC}} ++(2,0) ;
    \draw [line] ([yshift=-10mm] rect.east) -- node[below] {\textit{PSW}} ++(2,0);
    \draw [line] (rect.north) -- node[right] {\textit{Enable}} ++(0,1);
                        \end{tikzpicture}
  \end{tabularx}
\end{table}
\end{document}