

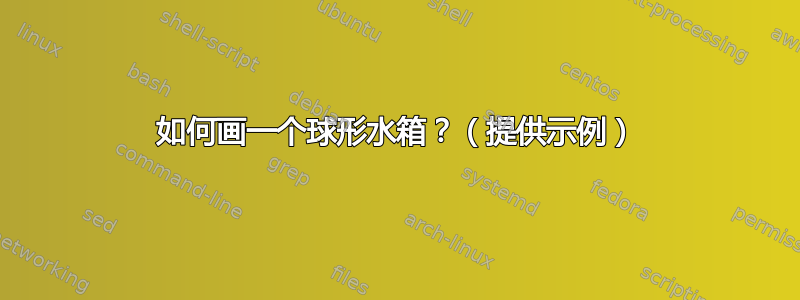
我想画一个球形水箱,底部有一个小出口,并指定所有需要的信息,如水位、水箱半径和出口半径。
我想要一些类似于这些例子的东西:


非常感谢。
编辑1:这是我的尝试:
\documentclass[border=5mm]{standalone}
\usepackage{tikz}
\begin{document}
\begin{tikzpicture}
    \def\r{3}
    \draw (orig) circle (\r);
    \fill[fill=black] (0,0) circle (1pt);
    \draw[dashed] (0,0 ) -- node[above]{$R$} (3,0);
      \draw[|-|] (4,0) --
        node[fill=white,font=\footnotesize,inner ysep=2pt,inner xsep=0]{$h$}(4,-3);
\end{tikzpicture}
\end{document}

答案1
水的高度由参数给出\H。
\documentclass[border=5mm]{standalone}
\usepackage{tikz}
\usetikzlibrary{shadings}
\begin{document}
\begin{tabular}{cc}
\begin{tikzpicture}[>=latex]
    \def\r{3}
    \def\H{1.5}
    \begin{scope}
    \draw[clip,-] ({\r*cos(-95)},{\r*sin(-95)})
    --++ (0,{-0.1*\r}) --++ ({2*\r *sin(5)},0) -- ({\r*cos(-85)},{\r*sin(-85)}) arc [start angle=-85,end
    angle=265,radius=\r];
    \shade[top color=blue!50!gray,bottom color=blue!20!white,opacity=0.6]
 ({-\r},{-1.1*\r}) rectangle ++({2*\r},{0.1*\r+\H});
    \end{scope}
    \draw[thick,->] (0,{-1.05*\r}) -- ++(0,{-0.3*\r}) node[right]{$v_e$};

    \fill[fill=black] (0,0) circle (1pt);
    \draw[dashed,|<->|] (0,0 ) -- node[above]{$R$} (210:\r);
    \draw[|<->|] (4,{-\r}) --
        node[fill=white,font=\footnotesize,inner ysep=2pt,inner xsep=0]{$h$}
        (4,{-\r+\H});
\end{tikzpicture}
&
\begin{tikzpicture}[>=latex]
    \def\r{3}
    \def\H{1.5}
    \begin{scope}
    \draw[clip,-] ({\r*cos(-95)},{\r*sin(-95)})
    --++ (0,{-0.1*\r}) --++ ({2*\r *sin(5)},0) -- ({\r*cos(-85)},{\r*sin(-85)}) arc [start angle=-85,end
    angle=265,radius=\r];
    \shade[ball color=gray!15,opacity=0.5] (0,0) circle (\r);
    \shade[top color=blue!50!gray,bottom color=blue!20!white,opacity=0.6]
 ({-\r},{-1.1*\r}) rectangle ++({2*\r},{0.1*\r+\H});
    \fill[blue!50] (0,{-\r+\H}) circle [x radius={sqrt(\r^2-(\r-\H)^2)},
    y radius={0.2*sqrt(\r^2-(\r-\H)^2)}];
    \end{scope}
    \draw[thick,->] (0,{-1.05*\r}) -- ++(0,{-0.3*\r}) node[right]{$v_e$};
    \fill[fill=black] (0,0) circle (1pt);
    \draw[dashed,|<->|] (0,0 ) -- node[above]{$R$} (210:\r);
    \draw[|<->|] (4,{-\r}) --
        node[fill=white,font=\footnotesize,inner ysep=2pt,inner xsep=0]{$h$}
        (4,{-\r+\H});
\end{tikzpicture}
\\
\begin{tikzpicture}[>=latex]
    \def\r{3}
    \def\H{1}
    \begin{scope}
    \draw[clip,-] ({\r*cos(-95)},{\r*sin(-95)})
    --++ (0,{-0.1*\r}) --++ ({2*\r *sin(5)},0) -- ({\r*cos(-85)},{\r*sin(-85)}) arc [start angle=-85,end
    angle=265,radius=\r];
    \shade[top color=blue!40!gray,bottom color=blue!20!white,opacity=0.6] ({-\r},{-1.1*\r}) rectangle ++({2*\r},{0.1*\r+\H});
    \end{scope}
    \draw[thick,-] ({0.3*\r-0.1},{-1.*\r+\H-0.1}) -- ++({0.2*\r+0.2},0);
    \draw[thick,-] ({0.3*\r},{-1.*\r+\H-0.2}) -- ++(0.2*\r,0);
    \draw[thick,-] ({0.4*\r},{-1.*\r+\H}) -- ++(0.2,0.4) -- ++ (-0.4,0) -- cycle;
    \draw[thick,->] (0,{-1.05*\r}) -- ++(0,{-0.3*\r}) node[right]{$v_e$};

    \fill[fill=black] (0,0) circle (1pt);
    \draw[dashed,|<->|] (0,0 ) -- node[above]{$R$} (210:\r);
    \draw[|<->|] (4,{-\r}) --
        node[fill=white,font=\footnotesize,inner ysep=2pt,inner xsep=0]{$h$}
        (4,{-\r+\H});
\end{tikzpicture}
&
\begin{tikzpicture}[>=latex]
    \def\r{3}
    \def\H{1}
    \begin{scope}
    \draw[clip,-] ({\r*cos(-95)},{\r*sin(-95)})
    --++ (0,{-0.1*\r}) --++ ({2*\r *sin(5)},0) -- ({\r*cos(-85)},{\r*sin(-85)}) arc [start angle=-85,end
    angle=265,radius=\r];
    \shade[ball color=gray!15,opacity=0.5] (0,0) circle (\r);
    \shade[top color=blue!40!gray,bottom color=blue!20!white,opacity=0.6] ({-\r},{-1.1*\r}) rectangle ++({2*\r},{0.1*\r+\H});
    \fill[blue!40] (0,{-\r+\H}) circle [x radius={sqrt(\r^2-(\r-\H)^2)},
    y radius={0.2*sqrt(\r^2-(\r-\H)^2)}];
    \end{scope}
    \draw[-,blue] ({0.4*\r},{-1.*\r+\H}) circle [x radius={0.2*\r}, y
    radius={0.06*\r}];
    \draw[thick,-,blue] ({0.4*\r},{-1.*\r+\H}) circle [x radius={0.15*\r}, y
    radius={0.04*\r}];
    \draw[-,blue] ({0.4*\r},{-1.*\r+\H}) circle [x radius={0.1*\r}, y
    radius={0.021*\r}];
    \draw[thick,-] ({0.4*\r},{-1.*\r+\H}) -- ++(0.2,0.4) -- ++ (-0.4,0) -- cycle;
    \draw[thick,->] (0,{-1.05*\r}) -- ++(0,{-0.3*\r}) node[right]{$v_e$};

    \fill[fill=black] (0,0) circle (1pt);
    \draw[dashed,|<->|] (0,0 ) -- node[above]{$R$} (210:\r);
    \draw[|<->|] (4,{-\r}) --
        node[fill=white,font=\footnotesize,inner ysep=2pt,inner xsep=0]{$h$}
        (4,{-\r+\H});
\end{tikzpicture}
\\
\multicolumn{2}{c}{\begin{tikzpicture}[>=latex]
    \def\r{3}
    \def\H{1}
    \draw[thick] ({\r*cos(95)},{\r*sin(95)})
    --++ (0,{0.2*\r}) --++ ({-0.2*\r },0) --++ (0,{0.1*\r })
    --++ ({0.2*\r+2*\r *sin(5)},0) -- ++ (0,{-0.3*\r }) node[right,midway] {1 m}
    -- ({\r*cos(85)},{\r*sin(85)}) arc [start angle=85,end
    angle=-265,radius=\r];
    \draw[thick] (-\r,0) arc [start angle=-180,end angle=0,x radius=\r,
    y radius={0.3*\r}];
    \draw[thick,dotted] (\r,0) arc [start angle=0,end angle=180,x radius=\r,
    y radius={0.3*\r}];
    \node[circle,fill,minimum width=3pt] (O) at (0,0) {};
    \draw[thick,dotted] (O) -- ++(\r,0) node[midway,below]{3 m};
    \draw[thick,->] ({\r+1},\r) --++(0,{-2*\r-1});
    \draw[thick,dotted] ({1},{\r}) --({\r+0.7},{\r});
    \draw[thick,-] ({\r+0.9},{\r}) --++({0.2},0) node[right] {$0$};
    \draw[thick,-] ({\r+0.9},{\r-1}) --++({0.2},0) node[right] {$y$};
    \draw[thick,dotted] ({1},{-\r}) --({\r+0.7},{-\r});
    \draw[thick,-] ({\r+0.9},{-\r}) --++({0.2},0) node[right] {$6$};
\end{tikzpicture}}
\end{tabular}
\end{document}

我添加了一些前两张图片的伪 3D 版本。