

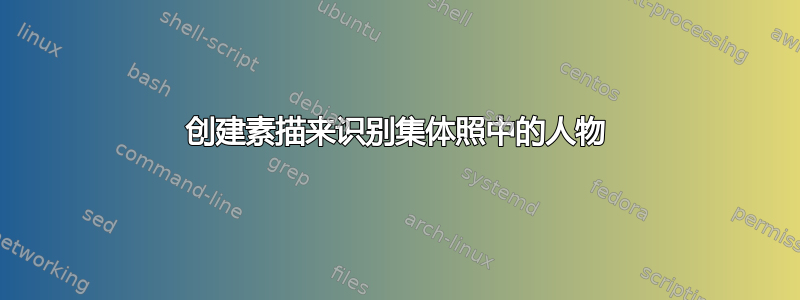
如何创建像右侧编号椭圆形的草图来帮助识别集体照中的人物?以 1927 年第五届索尔维会议的集体照为例

如果您想在其他图像上测试答案,这里有一些由@StevenB.Segletes 贡献的类似图片
从1913年第二届索尔维会议开始:

以及 BRL SAC 的一份(1940 年)

顺便说一句,世界上第一台计算机 ENIAC 就位于背景中正在建造的建筑物的一翼(B328,APG,MD)。
答案1
以下示例采用两步方法。
第一步:标记人物
可以使用以下方式显示网格覆盖的图像
\tagimage[\linewidth]{700px-Solvay_conference_1927}

这样可以更轻松地获取人物的坐标。它们被逐一添加到\tagpeople{}宏中。
例如添加一个连续编号的人员:
\tagpeople{
    \tagperson{0.060,0.505}
}
或者具有用户定义标签的人:
\tagpersonlabel{0.060,0.505}{x}
(这两个命令还可以使用可选参数来移动标签的位置,例如\tagperson[xshift=0.5cm]{0.150,0.485}或\tagpersonlabel[yshift=0.5cm]{0.092,0.455}{x})
第二步:显示标记的图像
编号的省略号现在可以显示为\showtags[\linewidth]{700px-Solvay_conference_1927}

或者,可以使用以下方式显示与椭圆叠加的半透明版本图像\showtagsimage[\linewidth]{700px-Solvay_conference_1927}

完整 MWE:
\documentclass{article}

\usepackage[
%   showframe=true
]{geometry}
\usepackage{xcolor}
\usepackage{xparse}
\usepackage{tikz}

\makeatletter

\tikzset{%
    tag ellipse/.style={%
        black!80!white,
        fill=white,
    },
    tag label/.style={%
        black,
    },
}

\newlength{\tagimage@y}
\newcounter{tagimage@count}

\newcommand{\@tagpeople}{}
\newcommand{\tagpeople}[1]{%
    \def\@tagpeople{#1}%
}

\newcommand{\tagpersonlabel}[3][]{%
    \stepcounter{tagimage@count}%
    \draw[tag ellipse] (#2) ellipse [x radius=0.019, y radius=0.038] node[tag label,#1] {#3};%
}

\newcommand{\tagperson}[2][]{%
    \stepcounter{tagimage@count}%
    \draw[tag ellipse] (#2) ellipse [x radius=0.019, y radius=0.038] node[tag label,#1] {\thetagimage@count};%
}

%%%%%%%%%%%%%%%%%%%%%%%%%%%%%%%%%%%%%%%%%%%%%%%%%%%%%%%%%%%%%%%%%%%%%%
%
% create debug plot to place the ellipses and labels
%
%%%%%%%%%%%%%%%%%%%%%%%%%%%%%%%%%%%%%%%%%%%%%%%%%%%%%%%%%%%%%%%%%%%%%%

% parameter:
% #1 [optional] image width, default \linewidth
% #2 image name
\newcommand{\tagimage}[2][\linewidth]{%
    \setcounter{tagimage@count}{0}%
    \noindent%
    \settoheight{\tagimage@y}{\includegraphics[width=#1]{#2}}%
    \begin{tikzpicture}[x=#1,y=\tagimage@y]%

        % origional image %%%%%%%%%%%%%%%%%%%%%%%%%%%%%%%%%%%%%%%%%%%%%%%%
        \node[anchor=south west,inner sep=0] at (0,0) {\includegraphics[width=#1]{#2}};

        % grid for positioning %%%%%%%%%%%%%%%%%%%%%%%%%%%%%%%%%%%%%%%%%%%
        \begin{pgfinterruptboundingbox}
            \draw[help lines,xstep=.025,ystep=.025,gray] (0,0) grid (1,1);
            \draw[help lines,xstep=.1,ystep=.1,white] (0,0) grid (1,1);
            \foreach \x in {0,1,...,9} { \node [anchor=north] at (\x/10,0) {.\x}; }
            \foreach \y in {0,1,...,9} { \node [anchor=east] at (0,\y/10) {.\y}; }
        \end{pgfinterruptboundingbox}

        % ellipses %%%%%%%%%%%%%%%%%%%%%%%%%%%%%%%%%%%%%%%%%%%%%%%%%%%%%%%
        \@tagpeople%

    \end{tikzpicture}%
}

%%%%%%%%%%%%%%%%%%%%%%%%%%%%%%%%%%%%%%%%%%%%%%%%%%%%%%%%%%%%%%%%%%%%%%
%
% display just ellipses and tags
%
%%%%%%%%%%%%%%%%%%%%%%%%%%%%%%%%%%%%%%%%%%%%%%%%%%%%%%%%%%%%%%%%%%%%%%

% parameter:
% #1 [optional] image width, default \linewidth
% #2 image name
\newcommand{\showtags}[2][\linewidth]{%
    \noindent%
    \setcounter{tagimage@count}{0}%
    \settoheight{\tagimage@y}{\includegraphics[width=#1]{#2}}%
    \begin{tikzpicture}[x=#1,y=\tagimage@y]%
        \@tagpeople%
    \end{tikzpicture}%
}

%%%%%%%%%%%%%%%%%%%%%%%%%%%%%%%%%%%%%%%%%%%%%%%%%%%%%%%%%%%%%%%%%%%%%%
%
% display tags over semi-opaque image
%
%%%%%%%%%%%%%%%%%%%%%%%%%%%%%%%%%%%%%%%%%%%%%%%%%%%%%%%%%%%%%%%%%%%%%%

% parameter:
% #1 [optional] image width, default \linewidth
% #2 image name
% #3 [optional] south west corner of optional clip
% #4 [optional] north east corner of optional clip
\NewDocumentCommand{\showtagsimage}{ O{\linewidth} m O{0,0} O{1,1}}{%
    \noindent%
    \setcounter{tagimage@count}{0}%
    \settoheight{\tagimage@y}{\includegraphics[width=#1]{#2}}%
    \begin{tikzpicture}[x=#1,y=\tagimage@y]%

        % black/white image %%%%%%%%%%%%%%%%%%%%%%%%%%%%%%%%%%%%%%%%%%%%%%
        \clip (#3) rectangle (#4);
        \node[anchor=south west,inner sep=0] at (0,0) {\includegraphics[width=#1]{#2}};
        \fill[white,opacity=0.7] (0,0) rectangle (1,1);

        % ellipses %%%%%%%%%%%%%%%%%%%%%%%%%%%%%%%%%%%%%%%%%%%%%%%%%%%%%%%
        \@tagpeople

    \end{tikzpicture}%
}
\makeatother

\begin{document}

\tagpeople{%
%   \tagpersonlabel{0.060,0.505}{1}
%   \tagpersonlabel[yshift=0.5cm]{0.092,0.455}{2}
%   \tagperson[xshift=0.5cm]{0.150,0.485}
    \tagperson{0.060,0.505}
    \tagperson{0.092,0.455}
    \tagperson{0.150,0.485}
    \tagperson{0.169,0.631}
    \tagperson{0.198,0.450}
    \tagperson{0.243,0.599}
    \tagperson{0.252,0.505}
    \tagperson{0.295,0.575}
    \tagperson{0.300,0.455}
    \tagperson{0.365,0.498}
    \tagperson{0.376,0.579}
    \tagperson{0.412,0.445}
    \tagperson{0.469,0.573}
    \tagperson{0.482,0.510}
    \tagperson{0.543,0.458}
    \tagperson{0.544,0.595}
    \tagperson{0.570,0.508}
    \tagperson{0.627,0.589}
    \tagperson{0.635,0.458}
    \tagperson{0.665,0.496}
    \tagperson{0.710,0.591}
    \tagperson{0.718,0.455}
    \tagperson{0.774,0.495}
    \tagperson{0.779,0.598}
    \tagperson{0.832,0.635}
    \tagperson{0.833,0.449}
    \tagperson{0.874,0.486}
    \tagperson{0.882,0.596}
    \tagperson{0.913,0.432}
}%

% debug plot
\tagimage[\linewidth]{700px-Solvay_conference_1927}%

\clearpage

% just the lables
\noindent
\includegraphics[width=\textwidth]{700px-Solvay_conference_1927}

{
\centering
\showtags[\linewidth]{700px-Solvay_conference_1927}

}%

\noindent 1: Debye, 2: Langmuir, 3: Knudsen, 4: Piccard, 5: Planck, 6: Henriot, 7: Bragg, 8: Ehrenfest, 9: Curie, 10: Kramers, 11: Herzen, 12: Lorentz, 13: de Donder, 14: Dirac, 15: Einstein, 16: Schrödinger, 17: Compton, 18: Verschaffelt, 19: Langevin, 20: de Broglie, 21: Pauli, 22: Guye, 23: Born, 24: Heisenberg, 25: Fowler, 26: Wilson, 27: Bohr, 28: Brillouin, 29: Richardson

\clearpage

% lables and semi-opaque image
\tikzset{%
    tag ellipse/.style={%
        black,
        fill=white,
        opacity=0.5
    },
}
\showtagsimage[\linewidth]{700px-Solvay_conference_1927}%

\noindent 1: Debye, 2: Langmuir, 3: Knudsen, 4: Piccard, 5: Planck, 6: Henriot, 7: Bragg, 8: Ehrenfest, 9: Curie, 10: Kramers, 11: Herzen, 12: Lorentz, 13: de Donder, 14: Dirac, 15: Einstein, 16: Schrödinger, 17: Compton, 18: Verschaffelt, 19: Langevin, 20: de Broglie, 21: Pauli, 22: Guye, 23: Born, 24: Heisenberg, 25: Fowler, 26: Wilson, 27: Bohr, 28: Brillouin, 29: Richardson

\end{document}
