

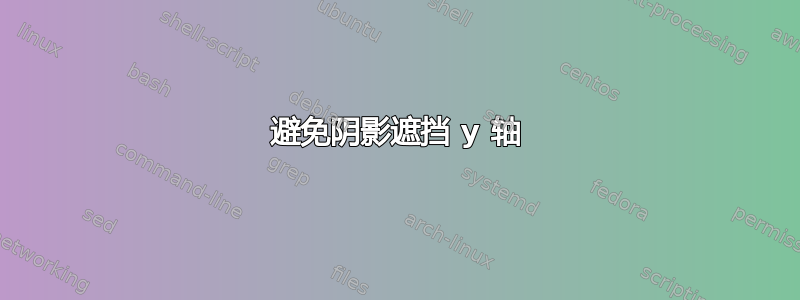
在笛卡尔平面上,绘制了一条直线和标准抛物线。三角形的顶点位于直线和抛物线的交点处,并且位于直线下方的抛物线上的一点,该三角形被阴影化。阴影稍微遮挡了 $y$ 轴。我该如何避免这种情况?
\documentclass[10pt]{amsart}
\usepackage{mathtools}

\usepackage{tikz}
\usetikzlibrary{calc,intersections}

\usepackage{pgfplots}
\pgfplotsset{compat=1.11}


\begin{document}

\noindent \begin{minipage}{4.5in}
\vskip0pt
\noindent \raggedright{\textbf{5.) }$y = mx + b$ is an equation for line $\ell$. If $b > 0$, the line and standard \\
parabola intersect at distinct points \textit{A} and \textit{B}. Among all triangles \\
with vertices at \textit{A} and \textit{B} and with a vertex on the parabola below \\
$\ell$, one encloses the biggest area. Compute the coordinates of the \\
vertex below $\ell$ of such a triangle.}
\end{minipage}
%
\hspace{0cm}
%
\raisebox{0mm}[0mm][0mm]
{
\begin{tikzpicture}[baseline=(current bounding box.west)]
\begin{axis}[width=2in, height=2in, axis equal image, unit vector ratio=2 1, axis on top, clip=false,
    axis lines=middle,
    xmin=-4,xmax=4, domain=-4:4,
    ymin=-2,ymax=9,
    restrict y to domain=-2:9,
    xtick={\empty},ytick={\empty},
    axis lines=middle,
    axis line style={latex-latex},
    xlabel=\textit{x},ylabel=\textit{y},
    axis line style={shorten >=-7.5pt, shorten <=-7.5pt},
    xlabel style={at={(ticklabel* cs:1)}, xshift=7.5pt, anchor=north west},
    ylabel style={at={(ticklabel* cs:1)}, yshift=7.5pt, anchor=south west}
]

%A line and the standard parabola are plotted. A triangle with vertices at the intersection
%of the line and parabola and at a point on the parabola below the line is drawn.
\addplot[samples=501, domain=-3:3] {x^2};
\addplot[samples=2, latex-latex, domain=-4:4] {(-2/3)*x + 4};

%A and B are the intersections of the line and parabola.
%x-intercept of the tangent line.
\coordinate (A) at ({-(1+sqrt(37))/3},{(38+2*sqrt(37))/9});
\coordinate (B) at ({-(1-sqrt(37))/3},{(38-2*sqrt(37))/9});
\coordinate (C) at (-1,1);

\coordinate (P) at (2.875,8.265625);
\coordinate (Q) at (1.4375,0);

\coordinate (S) at (-4,20/3);
\coordinate (T) at (0,4);

\end{axis}


\draw[fill] (A) circle (1.5pt);
\draw[fill] (B) circle (1.5pt);
\draw[fill] (C) circle (1.5pt);
\draw[fill=orange, opacity=0.5] (A) -- (B) -- (C) -- cycle;


\node[anchor=center, font=\scriptsize] at ($(S)!-0.15cm!(T)$){$\ell$};

%A "pin" is drawn to A.
\draw[draw=gray, shorten <=1mm, shorten >=1mm] (P) -- ($(P)!0.75cm!90:(Q)$) node[anchor=west, font=\scriptsize, inner sep=0]{\makebox[0pt][l]{$y=x^{2}$}};

\end{tikzpicture}
}

\end{document}
答案1
有一个选项可以实现这一点:axis on top=true其结果是:

笔记:
任何填充/绘图都应该完成之内环境
axis。这样做的原因是axis on top=true推迟轴的绘制,直到\end{axis}遇到。如果任何填充/绘制完成)后它将使轴线变得模糊。在下面的 MWE 中,我将三角形的代码移至前
\end{axis}。我注释掉了代码的文本部分,因为它与问题无关。另外,请注意后面
%的\end{tikzpicture}。
代码:
\documentclass[10pt]{amsart}
\usepackage{mathtools}

\usepackage{tikz}
\usetikzlibrary{calc,intersections}

\usepackage{pgfplots}
\pgfplotsset{compat=1.11}


\begin{document}
%
%\noindent \begin{minipage}{4.5in}
%\vskip0pt
%\noindent \raggedright{\textbf{5.) }$y = mx + b$ is an equation for line $\ell$. If $b > 0$, the line and standard \\
%parabola intersect at distinct points \textit{A} and \textit{B}. Among all triangles \\
%with vertices at \textit{A} and \textit{B} and with a vertex on the parabola below \\
%$\ell$, one encloses the biggest area. Compute the coordinates of the \\
%vertex below $\ell$ of such a triangle.}
%\end{minipage}
%%
%\hspace{0cm}
%%
%\raisebox{0mm}[0mm][0mm]
%{
\noindent
\begin{tikzpicture}[baseline=(current bounding box.west)]
\begin{axis}[width=2in, height=2in, axis equal image, unit vector ratio=2 1, axis on top, clip=false,
    axis lines=middle,
    xmin=-4,xmax=4, domain=-4:4,
    ymin=-2,ymax=9,
    restrict y to domain=-2:9,
    xtick={\empty},ytick={\empty},
    axis lines=middle,
    axis line style={latex-latex},
    xlabel=\textit{x},ylabel=\textit{y},
    axis line style={shorten >=-7.5pt, shorten <=-7.5pt},
    xlabel style={at={(ticklabel* cs:1)}, xshift=7.5pt, anchor=north west},
    ylabel style={at={(ticklabel* cs:1)}, yshift=7.5pt, anchor=south west},
    axis on top=true,
]

%A line and the standard parabola are plotted. A triangle with vertices at the intersection
%of the line and parabola and at a point on the parabola below the line is drawn.
\addplot[samples=501, domain=-3:3] {x^2};
\addplot[samples=2, latex-latex, domain=-4:4] {(-2/3)*x + 4};

%A and B are the intersections of the line and parabola.
%x-intercept of the tangent line.
\coordinate (A) at ({-(1+sqrt(37))/3},{(38+2*sqrt(37))/9});
\coordinate (B) at ({-(1-sqrt(37))/3},{(38-2*sqrt(37))/9});
\coordinate (C) at (-1,1);

\coordinate (P) at (2.875,8.265625);
\coordinate (Q) at (1.4375,0);

\coordinate (S) at (-4,20/3);
\coordinate (T) at (0,4);

\draw[fill] (A) circle (1.5pt);
\draw[fill] (B) circle (1.5pt);
\draw[fill] (C) circle (1.5pt);
\draw[fill=orange, fill opacity=0.5] (A) -- (B) -- (C) -- cycle;

\end{axis}


\node[anchor=center, font=\scriptsize] at ($(S)!-0.15cm!(T)$){$\ell$};

%A "pin" is drawn to A.
\draw[draw=gray, shorten <=1mm, shorten >=1mm] (P) -- ($(P)!0.75cm!90:(Q)$) node[anchor=west, font=\scriptsize, inner sep=0]{\makebox[0pt][l]{$y=x^{2}$}};

\end{tikzpicture}% <-- Note: This % here prevents spurious spaces.
%}
%
\end{document}