

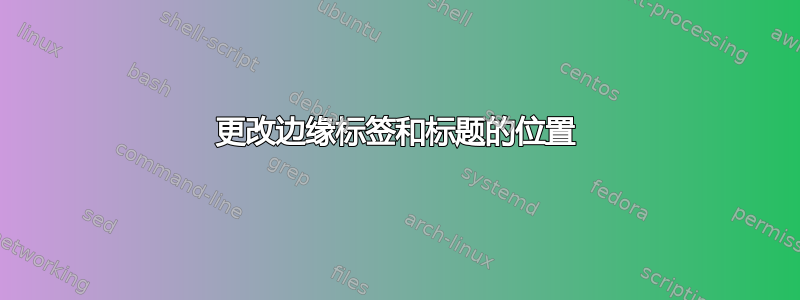
我已经创建了以下图表
\documentclass{article}
\usepackage[margin=1in]{geometry}
\usepackage{amsmath,amssymb}
\usepackage{tikz}
\usetikzlibrary{shapes.geometric,automata,positioning}
\newcommand{\N}{\mathbb{N}} % natuerliche Zahlen
    \newcommand{\Z}{\mathbb{Z}} % ganze Zahlen
    \newcommand{\Q}{\mathbb{Q}} % rationale Zahlen
    \newcommand{\R}{\mathbb{R}} % reelle Zahlen
    \newcommand{\Prob}{\mathbb{P}} % Symbol fuer Wahrscheinlichkeitsmaß
    \newcommand{\E}{\mathbb{E}} % Symbol fuer Erwartungswert
    \newcommand{\QAt}{\mathbf{Q}_{A_{2}A_{2}}}
    \newcommand{\QAo}{\mathbf{Q}_{A_{1}A_{1}}}
    \newcommand{\QAot}{\mathbf{Q}_{A_{1}A_{2}}}
    \newcommand{\QAto}{\mathbf{Q}_{A_{2}A_{1}}}
    \newcommand{\QAtC}{\mathbf{Q}_{A_{2}C}}
    \newcommand{\QAtw}{\mathbf{Q}_{A_{2}\{\omega\}}}
    \newcommand{\QAow}{\mathbf{Q}_{A_{1}\{\omega\}}}
    \newcommand{\I}{\mathbf{I}}
    \newcommand{\vf}{\mathbf{v}}
    \newcommand{\Df}{\mathbf{D}}
    \newcommand{\af}{\pmb{\alpha}}
    \newcommand{\eef}{\mathbf{e}}
    \newcommand{\Psf}{\pmb{\Psi}}
    \newcommand{\Phf}{\pmb{\Phi}}
    \newcommand{\bef}{\pmb{\beta}}
    \newcommand{\Pf}{\mathbf{P}}
    \newcommand{\Qf}{\mathbf{Q}}
    \newcommand{\mf}{\mathbf{m}}
    \newcommand{\ef}{\pmb{\varepsilon}}
    \newcommand{\Hf}{\mathbf{H}}
    \newcommand{\Ef}{\mathbf{E}}
    \newcommand{\Mf}{\mathbf{M}}
    \newcommand{\Vf}{\mathbf{V}}
    \newcommand{\gf}{\mathbf{g}}
    \newcommand{\QSo}{\mathbf{Q}_{S' S'}}
    \newcommand{\QSot}{\mathbf{Q}_{S' S''}}
    \newcommand{\QSt}{\mathbf{Q}_{S'' S''}}
    \newcommand{\UP}[2]{\makebox[0pt]{\smash{\raisebox{1.5em}{$\phantom{#2}#1$}}}#2}
    \newcommand{\LF}[1]{\makebox[0pt]{$#1$\hspace{4.5em}}}
    \newcommand{\zfo}{\mathbf{z}_{1}}
    \newcommand{\zft}{\mathbf{z}_{2}}
    \newcommand{\zf}{\mathbf{z}}
\begin{document}
\begin{figure}
\centering
\begin{tikzpicture}[->,>=stealth,shorten >=1pt,auto,node distance=2cm,
                    semithick,
 every state/.append style={fill=red,draw=none,text=white,circle},
 every loop/.append style={looseness=5}]
  \path[use as bounding box] (-2.7,0.45) rectangle (15,-10.65);
  \node[state]         (A)              {$A_{2}(0)$};
  \node                (B) [right=of A] {$\{\omega\}$};
  \node[state]         (C) [right=of B] {$A_{1}(0)$};
  \node[state]         (D) [below=of A] {$A_{2}(1)$};
  \node                (E) [right=of D] {$\{\omega\}$};
  \node[state]         (F) [right=of E] {$A_{1}(1)$};
  \node[state]         (G) [below=of D] {$A_{2}$(n{-}2)};
  \node                (H) [right=of G] {$\{\omega\}$};
  \node[state]         (I) [right=of H] {$A_{1}$(n{-}2)};
  \node[state]         (J) [below=of G]  {$A_{2}$(n{-}1)};
  \node                (K) [right=of J] {$\{\omega\}$};
  \node[state]         (L) [right=of K] {$A_{1}$(n{-}1)};


  \path (A) edge              node {$\QAtw$}                        (B)
            edge [left]       node {$\QAt$}                         (D)
            edge              node {$\QAto$}                        (F)
        (C) edge [above]      node {$\QAow$}                        (B)
            edge [above]      node {$\QAot$}                        (D)
            edge [right]      node {$\QAo$}                         (F)
        (D) edge              node {$\QAtw$}                        (E)
                              node(aux) {}                          (G)
        (F) edge [above]      node {$\QAow$}                        (E)
                              node(aux1) {}                         (I)
        (G) edge              node {$\QAtw$}                        (H)
            edge [left]       node {$\QAt$}                         (J)
            edge              node {$\QAto$}                        (L)
        (I) edge [above]      node {$\QAow$}                        (H)
            edge              node {$\QAot$}                        (J)
            edge              node {$\QAo$}                         (L)
        (J) edge [above]      node {$1$}                            (K)
        (L) edge [above]      node {$1$}                            (K);
\node[below=8mm of aux,font=\bfseries\Huge]{\vdots};
\node[below=8mm of aux1,font=\bfseries\Huge]{\vdots};
\end{tikzpicture}
\caption{\"Ubergangsgraph von $X$.}\label{Abbildung4}
\end{figure}
\end{document}
如下所示

问题是我想改变两个子图中间边标签的位置,同时让标题不出现在图中。谢谢您的帮助
它应该如下所示

答案1
@marmot建议使用poskey,这很好,但它无法让您完全按照自己的意愿进行操作。它只占用了 90% 的路程。以下是仅使用 key 时的效果pos=0.8(即从起始节点到终止节点的 80%):

您会注意到标签的位置并不准确。有两种方法(或两种方法)可以解决这个问题。最简单的方法是还除了 之外,还指定位置(例如above、east、等) 。这是完整的 MWE,以及为这些线标签指定的锚点和:belowpos=...pos
\documentclass{article}
\usepackage[margin=1in]{geometry}
\usepackage{amsmath,amssymb}
\usepackage{tikz}
\usetikzlibrary{shapes.geometric,automata,positioning}
\newcommand{\N}{\mathbb{N}} % natuerliche Zahlen
    \newcommand{\Z}{\mathbb{Z}} % ganze Zahlen
    \newcommand{\Q}{\mathbb{Q}} % rationale Zahlen
    \newcommand{\R}{\mathbb{R}} % reelle Zahlen
    \newcommand{\Prob}{\mathbb{P}} % Symbol fuer Wahrscheinlichkeitsmaß
    \newcommand{\E}{\mathbb{E}} % Symbol fuer Erwartungswert
    \newcommand{\QAt}{\mathbf{Q}_{A_{2}A_{2}}}
    \newcommand{\QAo}{\mathbf{Q}_{A_{1}A_{1}}}
    \newcommand{\QAot}{\mathbf{Q}_{A_{1}A_{2}}}
    \newcommand{\QAto}{\mathbf{Q}_{A_{2}A_{1}}}
    \newcommand{\QAtC}{\mathbf{Q}_{A_{2}C}}
    \newcommand{\QAtw}{\mathbf{Q}_{A_{2}\{\omega\}}}
    \newcommand{\QAow}{\mathbf{Q}_{A_{1}\{\omega\}}}
    \newcommand{\I}{\mathbf{I}}
    \newcommand{\vf}{\mathbf{v}}
    \newcommand{\Df}{\mathbf{D}}
    \newcommand{\af}{\pmb{\alpha}}
    \newcommand{\eef}{\mathbf{e}}
    \newcommand{\Psf}{\pmb{\Psi}}
    \newcommand{\Phf}{\pmb{\Phi}}
    \newcommand{\bef}{\pmb{\beta}}
    \newcommand{\Pf}{\mathbf{P}}
    \newcommand{\Qf}{\mathbf{Q}}
    \newcommand{\mf}{\mathbf{m}}
    \newcommand{\ef}{\pmb{\varepsilon}}
    \newcommand{\Hf}{\mathbf{H}}
    \newcommand{\Ef}{\mathbf{E}}
    \newcommand{\Mf}{\mathbf{M}}
    \newcommand{\Vf}{\mathbf{V}}
    \newcommand{\gf}{\mathbf{g}}
    \newcommand{\QSo}{\mathbf{Q}_{S' S'}}
    \newcommand{\QSot}{\mathbf{Q}_{S' S''}}
    \newcommand{\QSt}{\mathbf{Q}_{S'' S''}}
    \newcommand{\UP}[2]{\makebox[0pt]{\smash{\raisebox{1.5em}{$\phantom{#2}#1$}}}#2}
    \newcommand{\LF}[1]{\makebox[0pt]{$#1$\hspace{4.5em}}}
    \newcommand{\zfo}{\mathbf{z}_{1}}
    \newcommand{\zft}{\mathbf{z}_{2}}
    \newcommand{\zf}{\mathbf{z}}
\begin{document}
\begin{figure}
\centering
\begin{tikzpicture}[->,>=stealth,shorten >=1pt,auto,node distance=2cm,
                    semithick,
 every state/.append style={fill=red,draw=none,text=white,circle},
 every loop/.append style={looseness=5}]
  \path[use as bounding box] (-2.7,0.45) rectangle (15,-10.65);
  \node[state]         (A)              {$A_{2}(0)$};
  \node                (B) [right=of A] {$\{\omega\}$};
  \node[state]         (C) [right=of B] {$A_{1}(0)$};
  \node[state]         (D) [below=of A] {$A_{2}(1)$};
  \node                (E) [right=of D] {$\{\omega\}$};
  \node[state]         (F) [right=of E] {$A_{1}(1)$};
  \node[state]         (G) [below=of D] {$A_{2}$(n{-}2)};
  \node                (H) [right=of G] {$\{\omega\}$};
  \node[state]         (I) [right=of H] {$A_{1}$(n{-}2)};
  \node[state]         (J) [below=of G]  {$A_{2}$(n{-}1)};
  \node                (K) [right=of J] {$\{\omega\}$};
  \node[state]         (L) [right=of K] {$A_{1}$(n{-}1)};


    \path (A)   edge                        node {$\QAtw$}  (B)
                edge [left]                 node {$\QAt$}       (D)
                edge [pos=0.8]              node {$\QAto$}  (F)
        (C)     edge [above]                node {$\QAow$}  (B)
                edge [above left,pos=0.8]   node {$\QAot$}  (D)
                edge [right]                    node {$\QAo$}       (F)
        (D)     edge                        node {$\QAtw$}  (E)
                                            node(aux) {}        (G)
        (F)     edge [above]                node {$\QAow$}  (E)
                                            node(aux1) {}       (I)
        (G)     edge                        node {$\QAtw$}  (H)
                edge [left]                 node {$\QAt$}       (J)
                edge [pos=0.8]              node {$\QAto$}  (L)
        (I)     edge [above]                node {$\QAow$}  (H)
                edge [above left,pos=0.8]   node {$\QAot$}  (J)
                edge                        node {$\QAo$}       (L)
        (J)     edge [above]                node {$1$}          (K)
        (L)     edge [above]                node {$1$}          (K);

\node[below=8mm of aux,font=\bfseries\Huge]{\vdots};
\node[below=8mm of aux1,font=\bfseries\Huge]{\vdots};
\end{tikzpicture}
\caption{\"Ubergangsgraph von $X$.}\label{Abbildung4}
\end{figure}
\end{document}

在我看来,这满足了你的需要...但是如果你想更多的灵活性,也可以考虑使用xshift或yshift作为节点标签。在这里,我将xshift左下角问A1A2使用标签xshift=25(仅使用 25 来清晰显示变化)。回想一下,正数xshift向右移动,负数向左移动;正数yshift向上移动,负数向下移动。
在这个例子中,我只更改:
%edge [above left,pos=0.8]  node {$\QAot$}  (J)% without xshift (current version)
%%%%to
edge [above left,pos=0.8]   node[xshift=25] {$\QAot$}   (J)

希望这些选项能给您带来所需的灵活性!