

我想对这个代码做一些修改,从答案开始这个问题 作者 Claudio Fiandrino
\documentclass{beamer}
\usepackage{tikz}
\usetikzlibrary{arrows,automata,positioning}
\usepackage{verbatim}
\usetikzlibrary{calc,shadows}
%begin for smartart
\makeatletter
\@namedef{color@1}{red!30}
\@namedef{color@2}{cyan!30}
\@namedef{color@3}{blue!30}
\@namedef{color@4}{green!30}
\@namedef{color@5}{magenta!30}
\@namedef{color@6}{yellow!30}
\@namedef{color@7}{orange!30}
\@namedef{color@8}{violet!30}
\newcommand{\smartart}[1]{%
\begin{tikzpicture}[every node/.style={align=center}]
\foreach \gritem [count=\xi] in {#1}  {\global\let\maxgritem\xi}
\foreach \gritem [count=\xi] in {#1}
{%
\pgfmathtruncatemacro{\angle}{360/\maxgritem*\xi}
\edef\col{\@nameuse{color@\xi}}
\node[rectangle,
rounded corners,
 thick,
 draw=gray,
 top color= white,
 bottom color=\col,
 drop shadow,
 text width=1.75cm,
 minimum width=2cm,
 minimum height=1cm,
 font=\small] (satellite\xi) at (\angle:2.75cm) {\gritem };
}%
\foreach \gritem [count=\xi] in {#1}
{%
\pgfmathtruncatemacro{\xj}{mod(\xi, \maxgritem) + 1)}
\edef\col{\@nameuse{color@\xj}}
\draw[<-,>=stealth,line width=.1cm,\col,shorten <=0.3cm,shorten >=0.3cm] (satellite\xj) to[bend left] (satellite\xi);
}%
\end{tikzpicture}
}%
\tikzset{
invisible/.style={opacity=0},
visible on/.style={alt=#1{}{invisible}},
alt/.code args={<#1>#2#3}{%
  \alt<#1>{\pgfkeysalso{#2}}{\pgfkeysalso{#3}} % \pgfkeysalso doesn't change the path
},
  }
\newcommand{\smartartov}[1]{%
\begin{tikzpicture}[every node/.style={align=center}]
\foreach \gritem [count=\xi] in {#1}  {\global\let\maxgritem\xi}
\foreach \gritem [count=\xi] in {#1}
{%
\pgfmathtruncatemacro{\angle}{360/\maxgritem*\xi}
\edef\col{\@nameuse{color@\xi}}
\node[rectangle,
rounded corners,
 thick,
 draw=gray,
 top color= white,
 bottom color=\col,
 drop shadow={visible on=<\xi->},
 text width=1.75cm,
 minimum width=2cm,
 minimum height=1cm,
 font=\small,
 visible on=<\xi->] (satellite\xi) at (\angle:2.75cm) {\gritem };
}%
\foreach \gritem [count=\xi] in {#1}
{%
\pgfmathtruncatemacro{\xj}{mod(\xi, \maxgritem) + 1)}
\pgfmathtruncatemacro{\adv}{\xi + 1)}
\edef\col{\@nameuse{color@\xi}}
\draw[<-,>=stealth,line width=.1cm,\col,shorten <=0.3cm,shorten >=0.3cm,
visible on=<\adv->] (satellite\xj) to[bend left] (satellite\xi);
}%
\end{tikzpicture}
}%
\makeatother
%end for smartart
\begin{document}
\begin{frame}{Smart art}
\begin{center}
\smartartov{Low economic growth,Low income,Low saving,Low investment}
\end{center}
\end{frame}
\end{document}
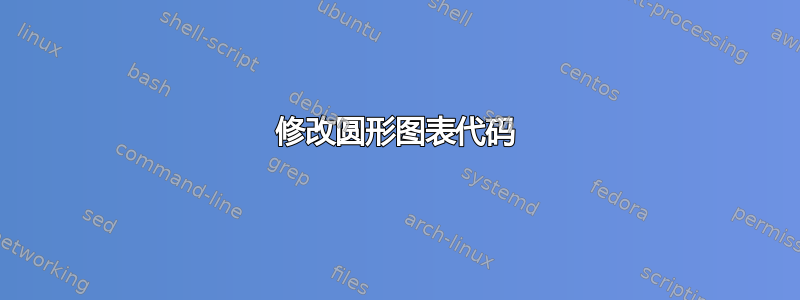
产生以下动画图形

循环顺时针而不是逆时针
如下图所示,双圆圈
没有动画
看起来像

不幸的是,我无法使用 smartdiagram。出于安全原因,我无法在工作场所计算机上安装程序包。
答案1
这是你可以用普通 Ti 做的事情钾Z。
\documentclass{beamer}
\usepackage{tikz}
\usetikzlibrary{calc,shadows.blur,positioning,arrows.meta,bending}
\begin{document}
\begin{frame}[fragile,t]
\frametitle{Smart art}
\begin{center}
 \begin{tikzpicture}[box/.style={rounded corners,blur shadow,text=white,align=center,
      minimum width=2.2cm, minimum height=1.9cm,fill=#1},
      node distance=5mm and 0mm,
      arr/.style={line width=1mm,-{Stealth[bend]},shorten >=7pt,shorten <=7pt}]
  \node[box=cyan] (TL) {Low\\ economic\\ growth};
  \node[box=purple!50!red,below right=of TL,font=\Large] (M) {Low\\ income};
  \node[box=purple!50!red,below left=of TL] (L) {Low\\ investment};
  \node[box=purple,below right=of L,font=\Large] (BL) {Low\\ saving};
  \node[box=cyan,above right=of M] (TR) {Low level of\\ education\\ and  health\\ care};
  \node[box=purple,below right=of M] (BR) {Low\\ productivity};
  \node[box=blue!80,below right=of TR] (R) {Low levels\\ of human\\ capital};
  %
  \draw[arr] (L.80)  to[bend left=45] (TL.190);
  \draw[arr] (TL.-10)  to[bend left=45] (M.100);
  \draw[arr] (M.80)  to[bend left=45] (TR.190);
  \draw[arr] (TR.-10)  to[bend left=45] (R.100);
  \draw[arr] (R.-100)  to[bend left=45] (BR.10);
  \draw[arr] (BR.170)  to[bend left=45] (M.-80);
  \draw[arr] (M.-100)  to[bend left=45] (BL.10);
  \draw[arr] (BL.170)  to[bend left=45] (L.-80);
  %
  \node[below=1mm of TL,font=\large,orange] {Growth};
  \node[below=1mm of TR,font=\large,orange] {Development};
 \end{tikzpicture}
\end{center}
\end{frame}
\end{document}
