

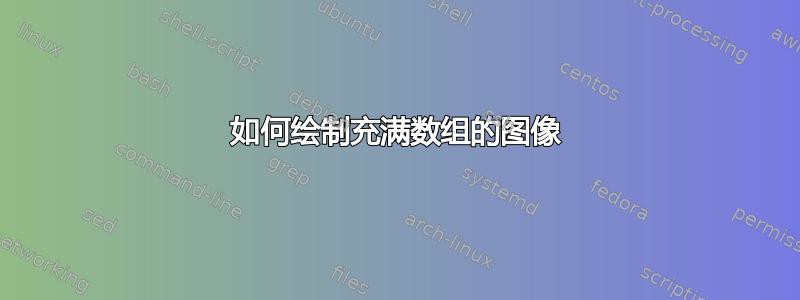
我不知道如何制作下面的图像。

查看我的代码
\documentclass{article}
\usepackage{tikz}
\usetikzlibrary{calc}
\begin{document}
  \begin{tikzpicture}
    \coordinate (s) at (0,0);
    \foreach \num in {5,2,7,-5,16,12}{
      \node[minimum size=6mm, draw, rectangle] at (s) {\num};
      \coordinate (s) at ($(s) + (1,0)$);
    }
  \end{tikzpicture}
\end{document}
问题:如何绘制图表中给出的图像?
答案1
下面的代码(很大程度上受到了Gonzalo Medina 的回答)可以作为起点:

\documentclass[border=2pt]{standalone}
\usepackage{tikz}
\usetikzlibrary{matrix,positioning,arrows.meta,arrows}

\tikzset{
mymat/.style={
  matrix of math nodes,
  text height=2.5ex,
  text depth=0.75ex,
  text width=3.25ex,
  align=center,
  row sep=-\pgflinewidth
  },
}
\begin{document}

\begin{tikzpicture}[>=latex]
\matrix[mymat,anchor=west,style={nodes=draw}]
at (0,0)
(mat1)
{
1\\
2\\
3\\
4\\
5\\
6\\
7\\
};
\matrix[mymat,right=of mat1,anchor=south,style={nodes={draw}},yshift=1.5cm]
(mat2)
{
1\\
2\\
};
\matrix[mymat,right=of mat2,anchor=center,style={nodes={draw}}]
(mat3)
{
1\\
2\\
};
\matrix[mymat,right=of mat3,anchor=center,style={nodes={draw}}]
(mat4)
{
1\\
2\\
};
\matrix[mymat,right=of mat1,anchor=north,style={nodes={draw}},yshift=-1.5cm]
(mat5)
{
1\\
2\\
};
\matrix[mymat,right=of mat5,anchor=center,style={nodes={draw}}]
(mat6)
{
1\\
2\\
};
\matrix[mymat,right=of mat6,anchor=center,style={nodes={draw}}]
(mat7)
{
1\\
2\\
};
\path[->]
  (mat1-1-1.center) edge[bend left=50] node [left] {} (mat2-1-1.north west);
\path[->]
  (mat1-1-1.center) edge[bend left=60] node [left] {} (mat3-1-1.north west);
\path[->]
  (mat1-1-1.center) edge[bend left=70] node [left] {} (mat4-1-1.north west);
\path[->]
  (mat1-7-1.center) edge[bend left=50] node [left] {} (mat5-1-1.north west);
\path[->]
  (mat1-7-1.center) edge[bend left=60] node [left] {} (mat6-1-1.north west);
\path[->]
  (mat1-7-1.center) edge[bend left=70] node [left] {} (mat7-1-1.north west);
\end{tikzpicture}

\end{document}