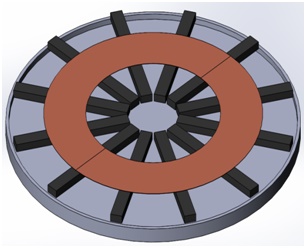
我正在尝试在 Tikz 中围绕中心点绘制一组旋转的矩形长方体。我在下面创建了一个示例,说明我在 OpenSCAD 中尝试实现的功能
使用代码在OpenSCAD中生成上图:
 for (i = [0:45:360]) {
    rotate([0,i,0])
    {
        translate([2,0,-0.5]){
            cube([2,0.5,1]);
        }
    }
}
目的是绘制感应电力传输磁耦合器(垫)中的铁氧体,我想绘制的图表示例如下
我认为,其他部分都很容易实现,但旋转的块是一个挑战。我猜是因为,正如许多人指出的那样,TikZ 没有 3D 引擎。
我已经尝试过做一些我想要的东西:
\documentclass[border=7pt]{standalone}

\usepackage{tikz}
\usepackage{tikz-3dplot}

%%%%%%%%%%%

\begin{document}

    \tdplotsetmaincoords{-60}{-50}

    \begin{tikzpicture}
    [
        tdplot_main_coords,
    ]

        \def\rounding{0.2pt};
        \foreach \i in {10,50,...,360}
        {
            \begin{scope}[rotate around={\i:(0.4,0,0.0)}]
                \pgfmathsetmacro{\cubex}{1}
                \pgfmathsetmacro{\cubey}{0.1}
                \pgfmathsetmacro{\cubez}{0.1}
                % http://tex.stackexchange.com/questions/12020/what-is-the-easiest-way-to-draw-3d-cube-with-tikz
                \draw[rounded corners = \rounding,fill=black!70] (0,0,0) -- ++(-\cubex,0,0) -- ++(0,-\cubey,0) -- ++(\cubex,0,0) -- cycle;
                \draw[rounded corners = \rounding,fill=black!70] (0,0,0) -- ++(0,0,-\cubez) -- ++(0,-\cubey,0) -- ++(0,0,\cubez) -- cycle;
                \draw[rounded corners = \rounding,fill=black!70] (0,0,0) -- ++(-\cubex,0,0) -- ++(0,0,-\cubez) -- ++(\cubex,0,0) -- cycle;
            \end{scope}
        }

    \end{tikzpicture}

\end{document}
目前看起来像这样
我必须将其设置\tdplotsetmaincoords{-60}{-50}为负数,否则你会看到长方体的“背面”。
我不知道如何让长方体圆圈向后倾斜到页面上,任何帮助都将不胜感激。我也不知道如何旋转立方体以使其看起来正确,目前看起来很奇怪。
答案1
在 3D 中旋转物体的正确方法tikz-3dplot是使用旋转坐标,对于绕 z 轴的旋转,您可以使用\tdplotsetrotatedcoords{\i}{00}{0}。然后,您使用的立方体是针对特定视角绘制的。为了使它们完全可旋转,您需要根据视角绘制不同的面。为此,我使用一个工具计算出投影是什么:get projections。这允许我们(仅)绘制最接近观察者的面(这就是为什么有\ifnums 来查看 x、y 和 z 投影)。
\documentclass[tikz,border=7pt]{standalone}
\usepackage{tikz-3dplot}
\tikzset{get projections/.style={insert path={%
let \p1=(1,0,0),\p2=(0,1,0)  in
[/utils/exec={\pgfmathtruncatemacro{\xproj}{sign(\x1)}\xdef\xproj{\xproj}
\pgfmathtruncatemacro{\yproj}{sign(\x2)}\xdef\yproj{\yproj}
\pgfmathtruncatemacro{\zproj}{sign(cos(\tdplotmaintheta))}\xdef\zproj{\zproj}}]}},
}
%%%%%%%%%%%

\begin{document}

\tdplotsetmaincoords{-60}{-50}

\begin{tikzpicture}[tdplot_main_coords]
    \pgfmathsetmacro{\cubex}{1}
    \pgfmathsetmacro{\cubey}{0.1}
    \pgfmathsetmacro{\cubez}{0.1}
    \pgfmathsetmacro{\cubedist}{0.4}
    \def\rounding{0.2pt};
    \foreach \i in {10,50,...,360}
    { \tdplotsetrotatedcoords{\i}{00}{0}
        \begin{scope}[tdplot_rotated_coords]
            \path[get projections];
            %\draw (-\cubedist,0,0) -- (-2,0,0)  node{\xproj,\yproj,\zproj};
            % http://tex.stackexchange.com/questions/12020/what-is-the-easiest-way-to-draw-3d-cube-with-tikz
            \ifnum\yproj=1
             \draw[rounded corners = \rounding,fill=black!70] (-\cubedist,0,0) -- ++(0,0,-\cubez) -- ++(0,-\cubey,0) -- ++(0,0,\cubez) -- cycle;
            \else
             \draw[rounded corners = \rounding,fill=black!70] (-\cubedist-\cubex,0,0) -- ++(0,0,-\cubez) -- ++(0,-\cubey,0) -- ++(0,0,\cubez) -- cycle;
            \fi
            \ifnum\xproj=1
             \draw[rounded corners = \rounding,fill=black!70] (-\cubedist,-\cubey,0) -- ++(-\cubex,0,0) -- ++(0,0,-\cubez) -- ++(\cubex,0,0) -- cycle;
            \else
             \draw[rounded corners = \rounding,fill=black!70] (-\cubedist,0,0) -- ++(-\cubex,0,0) -- ++(0,0,-\cubez) -- ++(\cubex,0,0) -- cycle;
            \fi
            \draw[rounded corners = \rounding,fill=black!70] (-\cubedist,0,-\cubez) -- ++(-\cubex,0,0) -- ++(0,-\cubey,0) -- ++(\cubex,0,0) -- cycle;
        \end{scope}
    }

\end{tikzpicture}

\end{document}
我个人更喜欢拨正的 theta 和正的长度,这样图形的完成可以说更加直接。然后,为了更接近 OpenSCAD 语法,我将长方体的定义存储在一个样式中(这当然不是第一篇定义长方体图片的帖子),其中尝试了自动着色,不如 pstricks 提供的那么复杂,当然也比 asymptote 更不令人信服。这张图片可以用作
\path (<coordinate>) pic{cuboid={x=<x>,y=<y>,z=<z>}};
当然,如果需要,还可以使其更加灵活(但这种灵活性会伴随稍长的代码)。还要注意,如果希望长方体彼此靠近,则必须注意绘制它们的顺序:需要先绘制那些靠后的长方体。
\documentclass[tikz,border=7pt]{standalone}
\usepackage{tikz-3dplot}
\tikzset{get projections/.style={insert path={%
let \p1=(1,0,0),\p2=(0,1,0)  in
[/utils/exec={\pgfmathtruncatemacro{\xproj}{sign(\x1)}\xdef\xproj{\xproj}
\pgfmathtruncatemacro{\yproj}{sign(\x2)}\xdef\yproj{\yproj}
\pgfmathtruncatemacro{\zproj}{sign(cos(\tdplotmaintheta))}\xdef\zproj{\zproj}}]}},
pics/cuboid/.style={code={\tikzset{cuboid/.cd,#1}
 \path[get projections];
 \ifnum\yproj=-1
  \draw let \p1=(1,0,0),\n1={atan2(\y1,\x1)}
  in [/utils/exec=\pgfmathsetmacro{\mybr}{70-20*sin(\n1)}]
  [rounded corners = \rounding,fill=black!\mybr]
     (0,-\cubey/2,0) -- ++(0,0,\cubez) -- ++(0,\cubey,0) -- ++(0,0,-\cubez) -- cycle;
 \else
  \draw let \p1=(1,0,0),\n1={atan2(\y1,\x1)}
  in [/utils/exec=\pgfmathsetmacro{\mybr}{70+20*sin(\n1)}]
  [rounded corners = \rounding,fill=black!\mybr]
     (0+\cubex,-\cubey/2,0) -- ++(0,0,\cubez) -- ++(0,\cubey,0) -- ++(0,0,-\cubez) -- cycle;
 \fi
 \ifnum\xproj=-1
  \draw let \p1=(0,1,0),\n1={atan2(\y1,\x1)}
  in [/utils/exec=\pgfmathsetmacro{\mybr}{70+20*sin(\n1)}]
  [rounded corners = \rounding,fill=black!\mybr]
     (0,\cubey/2,0) -- ++(\cubex,0,0) -- ++(0,0,\cubez) -- ++(-\cubex,0,0) -- cycle;
 \else
  \draw let \p1=(0,1,0),\n1={atan2(\y1,\x1)}
  in [/utils/exec=\pgfmathsetmacro{\mybr}{70-20*sin(\n1)}]
  [rounded corners = \rounding,fill=black!\mybr]
     (0,-\cubey/2,0) -- ++(\cubex,0,0) -- ++(0,0,\cubez) -- ++(-\cubex,0,0) -- cycle;
 \fi
  \draw let \p1=(0,0,1),\n1={atan2(\y1,\x1)}
  in [/utils/exec=\pgfmathsetmacro{\mybr}{70-20*sin(\n1)}]
   [rounded corners = \rounding,fill=black!\mybr]
     (0,-\cubey/2,\cubez) -- ++(\cubex,0,0) -- ++(0,\cubey,0) --
     ++(-\cubex,0,0) -- cycle;}},
 cuboid/.cd,x/.estore in=\cubex,y/.estore in=\cubey,z/.estore
 in=\cubez,rounding/.estore in=\rounding,rounding=0.2pt
}
%%%%%%%%%%%
\definecolor{bred}{RGB}{151,73,59}
\begin{document}

\tdplotsetmaincoords{60}{-50}

\begin{tikzpicture}[tdplot_main_coords,cuboid/.cd,x=4,y=0.4,z=0.4]
    \pgfmathsetmacro{\cubedist}{0.8}
    \fill[gray!40] plot[smooth,variable=\t,domain=0:360,samples=51]
        ({(\cubex+\cubedist)*cos(\t)},
        {(\cubex+\cubedist)*sin(\t)},-\cubez);
    \draw[ultra thin,left color=gray!60,right color=gray!80,middle color=gray!20]
        plot[smooth,variable=\t,domain=\tdplotmainphi:\tdplotmainphi+180]
        ({(\cubex+\cubedist)*cos(\t)},
        {(\cubex+\cubedist)*sin(\t)},0)
        --
        plot[smooth,variable=\t,domain=\tdplotmainphi+180:\tdplotmainphi]
        ({(\cubex+\cubedist)*cos(\t)},
        {(\cubex+\cubedist)*sin(\t)},-\cubez) -- cycle;
    \draw[ultra thin,left color=gray!80,right color=gray!60,middle color=gray!20]
        plot[smooth,variable=\t,domain=\tdplotmainphi:\tdplotmainphi-180]
        ({(\cubex+\cubedist)*cos(\t)},
        {(\cubex+\cubedist)*sin(\t)},0)
        --
        plot[smooth,variable=\t,domain=\tdplotmainphi-180:\tdplotmainphi]
        ({(\cubex+\cubedist)*cos(\t)},
        {(\cubex+\cubedist)*sin(\t)},-\cubez) -- cycle;
    \draw[ultra thin,fill=gray!10,even odd rule] plot[smooth,variable=\t,domain=0:360,samples=51]
        ({(\cubex+\cubedist)*cos(\t)},
        {(\cubex+\cubedist)*sin(\t)},0)
        plot[smooth,variable=\t,domain=0:360,samples=51]
        ({0.98*(\cubex+\cubedist)*cos(\t)},
        {0.98*(\cubex+\cubedist)*sin(\t)},0);
    \foreach \i in {50,90,130,170,10,-30,-70,...,-150} %<-note that this list depends on phi
    { \tdplotsetrotatedcoords{\i}{00}{0}
        \begin{scope}[tdplot_rotated_coords]
          \path (\cubedist,0,0) pic{cuboid};
        \end{scope}
    }
    \begin{scope}[canvas is xy plane at z=\cubez]
        \fill[bred,even odd rule] circle[radius=\cubex]
        circle[radius=0.6*\cubex];
        \draw[ultra thin] (0:0.6*\cubex) -- (0:\cubex)  (180:0.6*\cubex) -- (180:\cubex);
    \end{scope}
\end{tikzpicture}
\end{document}
与往常一样,视图可以旋转,并且可以自动对长方体进行适当的排序。
\documentclass[tikz,border=7pt]{standalone}
\usepackage{tikz-3dplot}
\tikzset{get projections/.style={insert path={%
let \p1=(1,0,0),\p2=(0,1,0)  in
[/utils/exec={\pgfmathtruncatemacro{\xproj}{sign(\x1)}\xdef\xproj{\xproj}
\pgfmathtruncatemacro{\yproj}{sign(\x2)}\xdef\yproj{\yproj}
\pgfmathtruncatemacro{\zproj}{sign(cos(\tdplotmaintheta))}\xdef\zproj{\zproj}}]}},
pics/cuboid/.style={code={\tikzset{cuboid/.cd,#1}
 \path[get projections];
 \ifnum\yproj=-1
  \draw let \p1=(1,0,0),\n1={atan2(\y1,\x1)}
  in [/utils/exec=\pgfmathsetmacro{\mybr}{70-20*sin(\n1)}]
  [rounded corners = \rounding,fill=black!\mybr]
     (0,-\cubey/2,0) -- ++(0,0,\cubez) -- ++(0,\cubey,0) -- ++(0,0,-\cubez) -- cycle;
 \else
  \draw let \p1=(1,0,0),\n1={atan2(\y1,\x1)}
  in [/utils/exec=\pgfmathsetmacro{\mybr}{70+20*sin(\n1)}]
  [rounded corners = \rounding,fill=black!\mybr]
     (0+\cubex,-\cubey/2,0) -- ++(0,0,\cubez) -- ++(0,\cubey,0) -- ++(0,0,-\cubez) -- cycle;
 \fi
 \ifnum\xproj=-1
  \draw let \p1=(0,1,0),\n1={atan2(\y1,\x1)}
  in [/utils/exec=\pgfmathsetmacro{\mybr}{70+20*sin(\n1)}]
  [rounded corners = \rounding,fill=black!\mybr]
     (0,\cubey/2,0) -- ++(\cubex,0,0) -- ++(0,0,\cubez) -- ++(-\cubex,0,0) -- cycle;
 \else
  \draw let \p1=(0,1,0),\n1={atan2(\y1,\x1)}
  in [/utils/exec=\pgfmathsetmacro{\mybr}{70-20*sin(\n1)}]
  [rounded corners = \rounding,fill=black!\mybr]
     (0,-\cubey/2,0) -- ++(\cubex,0,0) -- ++(0,0,\cubez) -- ++(-\cubex,0,0) -- cycle;
 \fi
  \draw let \p1=(0,0,1),\n1={atan2(\y1,\x1)}
  in [/utils/exec=\pgfmathsetmacro{\mybr}{70-20*sin(\n1)}]
   [rounded corners = \rounding,fill=black!\mybr]
     (0,-\cubey/2,\cubez) -- ++(\cubex,0,0) -- ++(0,\cubey,0) --
     ++(-\cubex,0,0) -- cycle;}},
 cuboid/.cd,x/.estore in=\cubex,y/.estore in=\cubey,z/.estore
 in=\cubez,rounding/.estore in=\rounding,rounding=0.2pt
}
%%%%%%%%%%%
\definecolor{bred}{RGB}{151,73,59}
\begin{document}
\pgfmathsetmacro{\xmin}{0}
\pgfmathsetmacro{\xmax}{0}
\pgfmathsetmacro{\ymin}{0}
\pgfmathsetmacro{\ymax}{0}
\foreach \X in {5,15,...,355}
{\tdplotsetmaincoords{60}{\X}
\begin{tikzpicture}[tdplot_main_coords,cuboid/.cd,x=4,y=0.4,z=0.4]
    \ifdefined\figbb\relax
    \path[tdplot_screen_coords] \figbb;
    \fi
    \pgfmathsetmacro{\cubedist}{0.8}
    \fill[gray!40] plot[smooth,variable=\t,domain=0:360,samples=51]
        ({(\cubex+\cubedist)*cos(\t)},
        {(\cubex+\cubedist)*sin(\t)},-\cubez);
    \draw[ultra thin,left color=gray!60,right color=gray!80,middle color=gray!20]
        plot[smooth,variable=\t,domain=\tdplotmainphi:\tdplotmainphi+180]
        ({(\cubex+\cubedist)*cos(\t)},
        {(\cubex+\cubedist)*sin(\t)},0)
        --
        plot[smooth,variable=\t,domain=\tdplotmainphi+180:\tdplotmainphi]
        ({(\cubex+\cubedist)*cos(\t)},
        {(\cubex+\cubedist)*sin(\t)},-\cubez) -- cycle;
    \draw[ultra thin,left color=gray!80,right color=gray!60,middle color=gray!20]
        plot[smooth,variable=\t,domain=\tdplotmainphi:\tdplotmainphi-180]
        ({(\cubex+\cubedist)*cos(\t)},
        {(\cubex+\cubedist)*sin(\t)},0)
        --
        plot[smooth,variable=\t,domain=\tdplotmainphi-180:\tdplotmainphi]
        ({(\cubex+\cubedist)*cos(\t)},
        {(\cubex+\cubedist)*sin(\t)},-\cubez) -- cycle;
    \draw[ultra thin,fill=gray!10,even odd rule] plot[smooth,variable=\t,domain=0:360,samples=51]
        ({(\cubex+\cubedist)*cos(\t)},
        {(\cubex+\cubedist)*sin(\t)},0)
        plot[smooth,variable=\t,domain=0:360,samples=51]
        ({0.98*(\cubex+\cubedist)*cos(\t)},
        {0.98*(\cubex+\cubedist)*sin(\t)},0);
    \pgfmathtruncatemacro{\tmpA}{10+\tdplotmainphi+90-mod(360+\tdplotmainphi+90,40)}
    \pgfmathtruncatemacro{\tmpB}{\tmpA+40}
    \pgfmathtruncatemacro{\tmpC}{\tmpA+160}
    \pgfmathtruncatemacro{\tmpD}{\tmpA-40}
    \pgfmathtruncatemacro{\tmpE}{\tmpA-80}
    \pgfmathtruncatemacro{\tmpF}{\tmpA-160}
    \foreach \i in {\tmpA,\tmpB,...,\tmpC,\tmpD,\tmpE,...,\tmpF} %<-automatized
    { \tdplotsetrotatedcoords{\i}{00}{0}
        \begin{scope}[tdplot_rotated_coords]
          \path (\cubedist,0,0) pic{cuboid};
        \end{scope}
    }
    \begin{scope}[canvas is xy plane at z=\cubez]
        \fill[bred,even odd rule] circle[radius=\cubex]
        circle[radius=0.6*\cubex];
        \draw[ultra thin] (0:0.6*\cubex) -- (0:\cubex)  (180:0.6*\cubex) -- (180:\cubex);
    \end{scope}
    \path let \p1=(current bounding box.south west),
    \p2=(current bounding box.north east)
    in \pgfextra{%
    \pgfmathsetmacro{\xmin}{min(\x1,\xmin)}
    \pgfmathsetmacro{\xmax}{max(\x2,\xmax)}
    \pgfmathsetmacro{\ymin}{min(\y1,\ymin)}
    \pgfmathsetmacro{\ymax}{max(\y2,\ymax)}
    \xdef\xmin{\xmin pt}
    \xdef\xmax{\xmax pt}
    \xdef\ymin{\ymin pt}
    \xdef\ymax{\ymax pt}
    };
\end{tikzpicture}}
\makeatletter
\edef\figbb{(\xmin,\ymin) rectangle (\xmax,\ymax)}
\immediate\write\@mainaux{\xdef\string\figbb{\figbb}\relax}
\makeatother
\end{document}


